Case Study: Sales + product enablement
Building data storytelling confidence through real-world practice
Helping sales teams transform data into meaningful customer stories.
Tools
Microsoft Word • Microsoft PowerPoint • Saba LMS • Google Sites • SnagIt
Design Foundations
Learning Experience Design • Human-Centered Design • Behavior Learning Theory • Rapid Prototyping • Successive Approximation Model (SAM) • UX/UI Principles • Accessibility • Gestalt Principles • Brand Alignment
Soft Skills
Cross-functional collaboration, content strategy, iterative design, product empathy, technical writing and editing for diverse audiences, change enablement and communication
Quick Facts
Role: Learning Experience Designer, Content Strategist, Technical Writer
Deliverables: Microlearning series for Atlassian Home product
Users: Globally distributed Atlassians
Challenge + Context
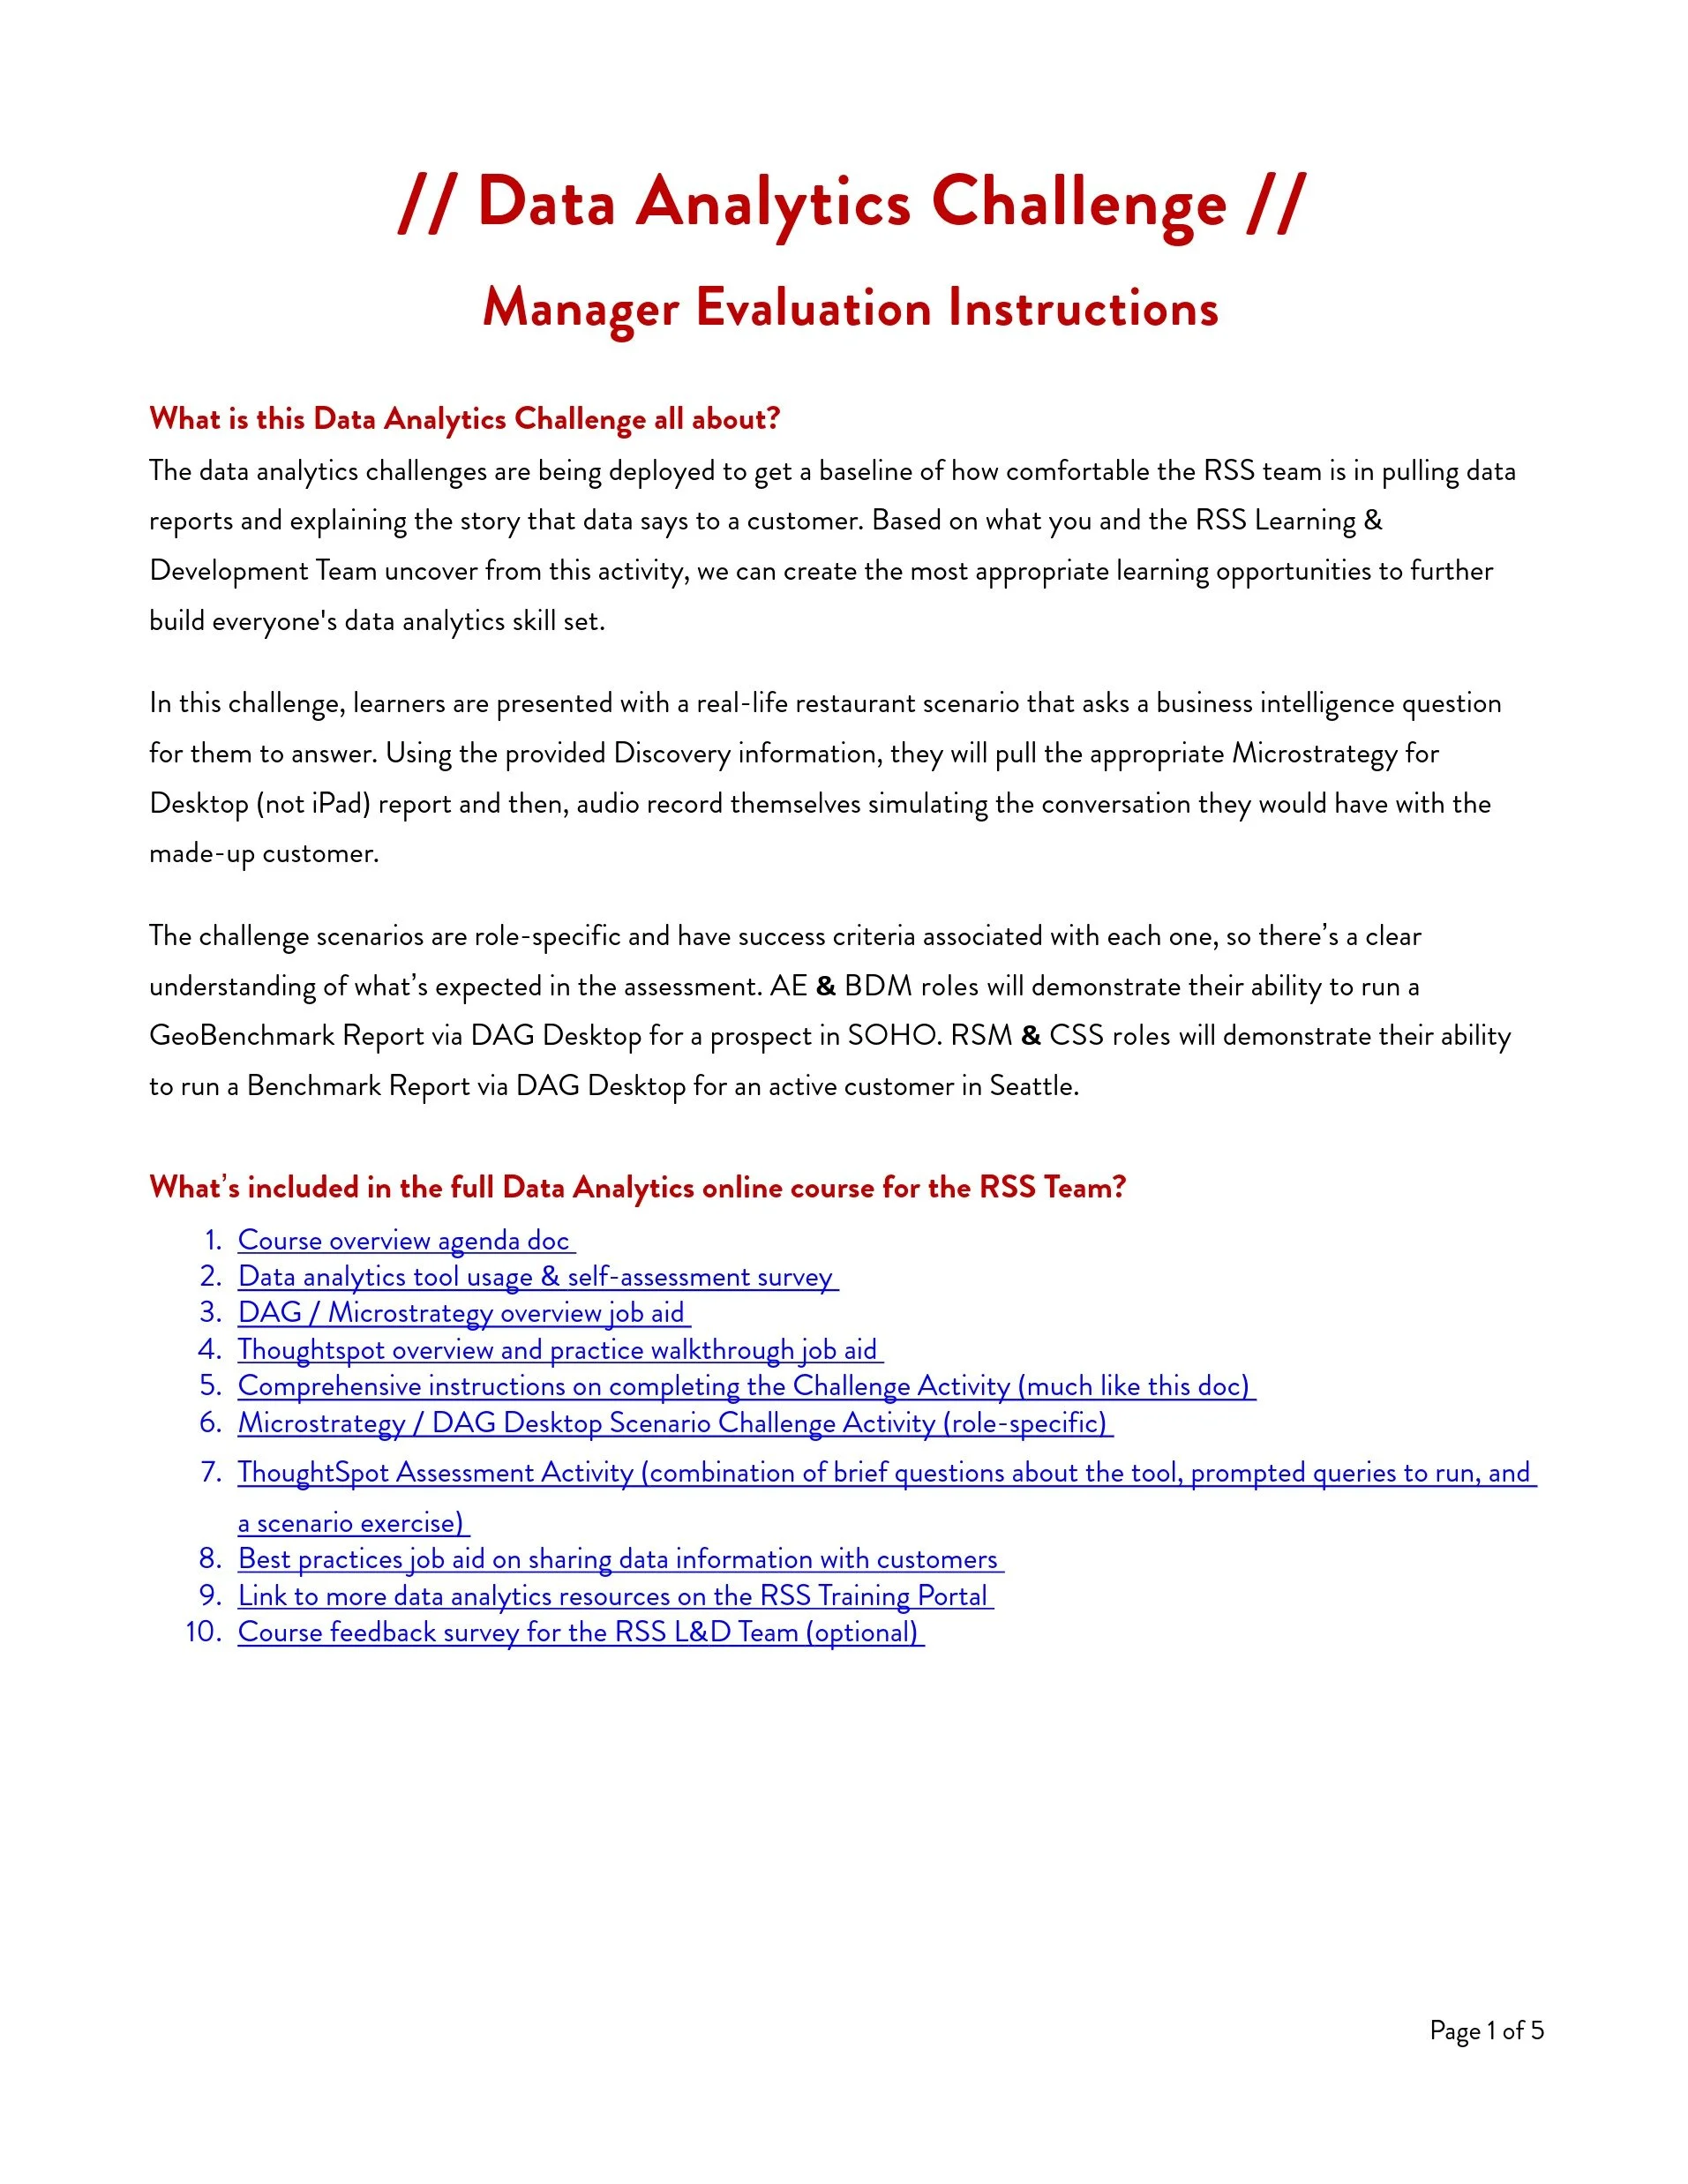
Although OpenTable’s sales and service teams had access to multiple analytics tools, their ability to interpret data and translate insights into compelling customer stories varied widely. This variability made it difficult to deliver consistent, insight-driven recommendations to restaurant partners.
The organization needed a clear baseline of analytics proficiency, a way to identify role-specific skill gaps, and a structured program that helped teams build stronger data storytelling confidence grounded in real customer scenarios.
Role-based benchmarking program to help sales teams transform data into meaningful customer stories.
Self-Guided Product Enablement
Process + Solution
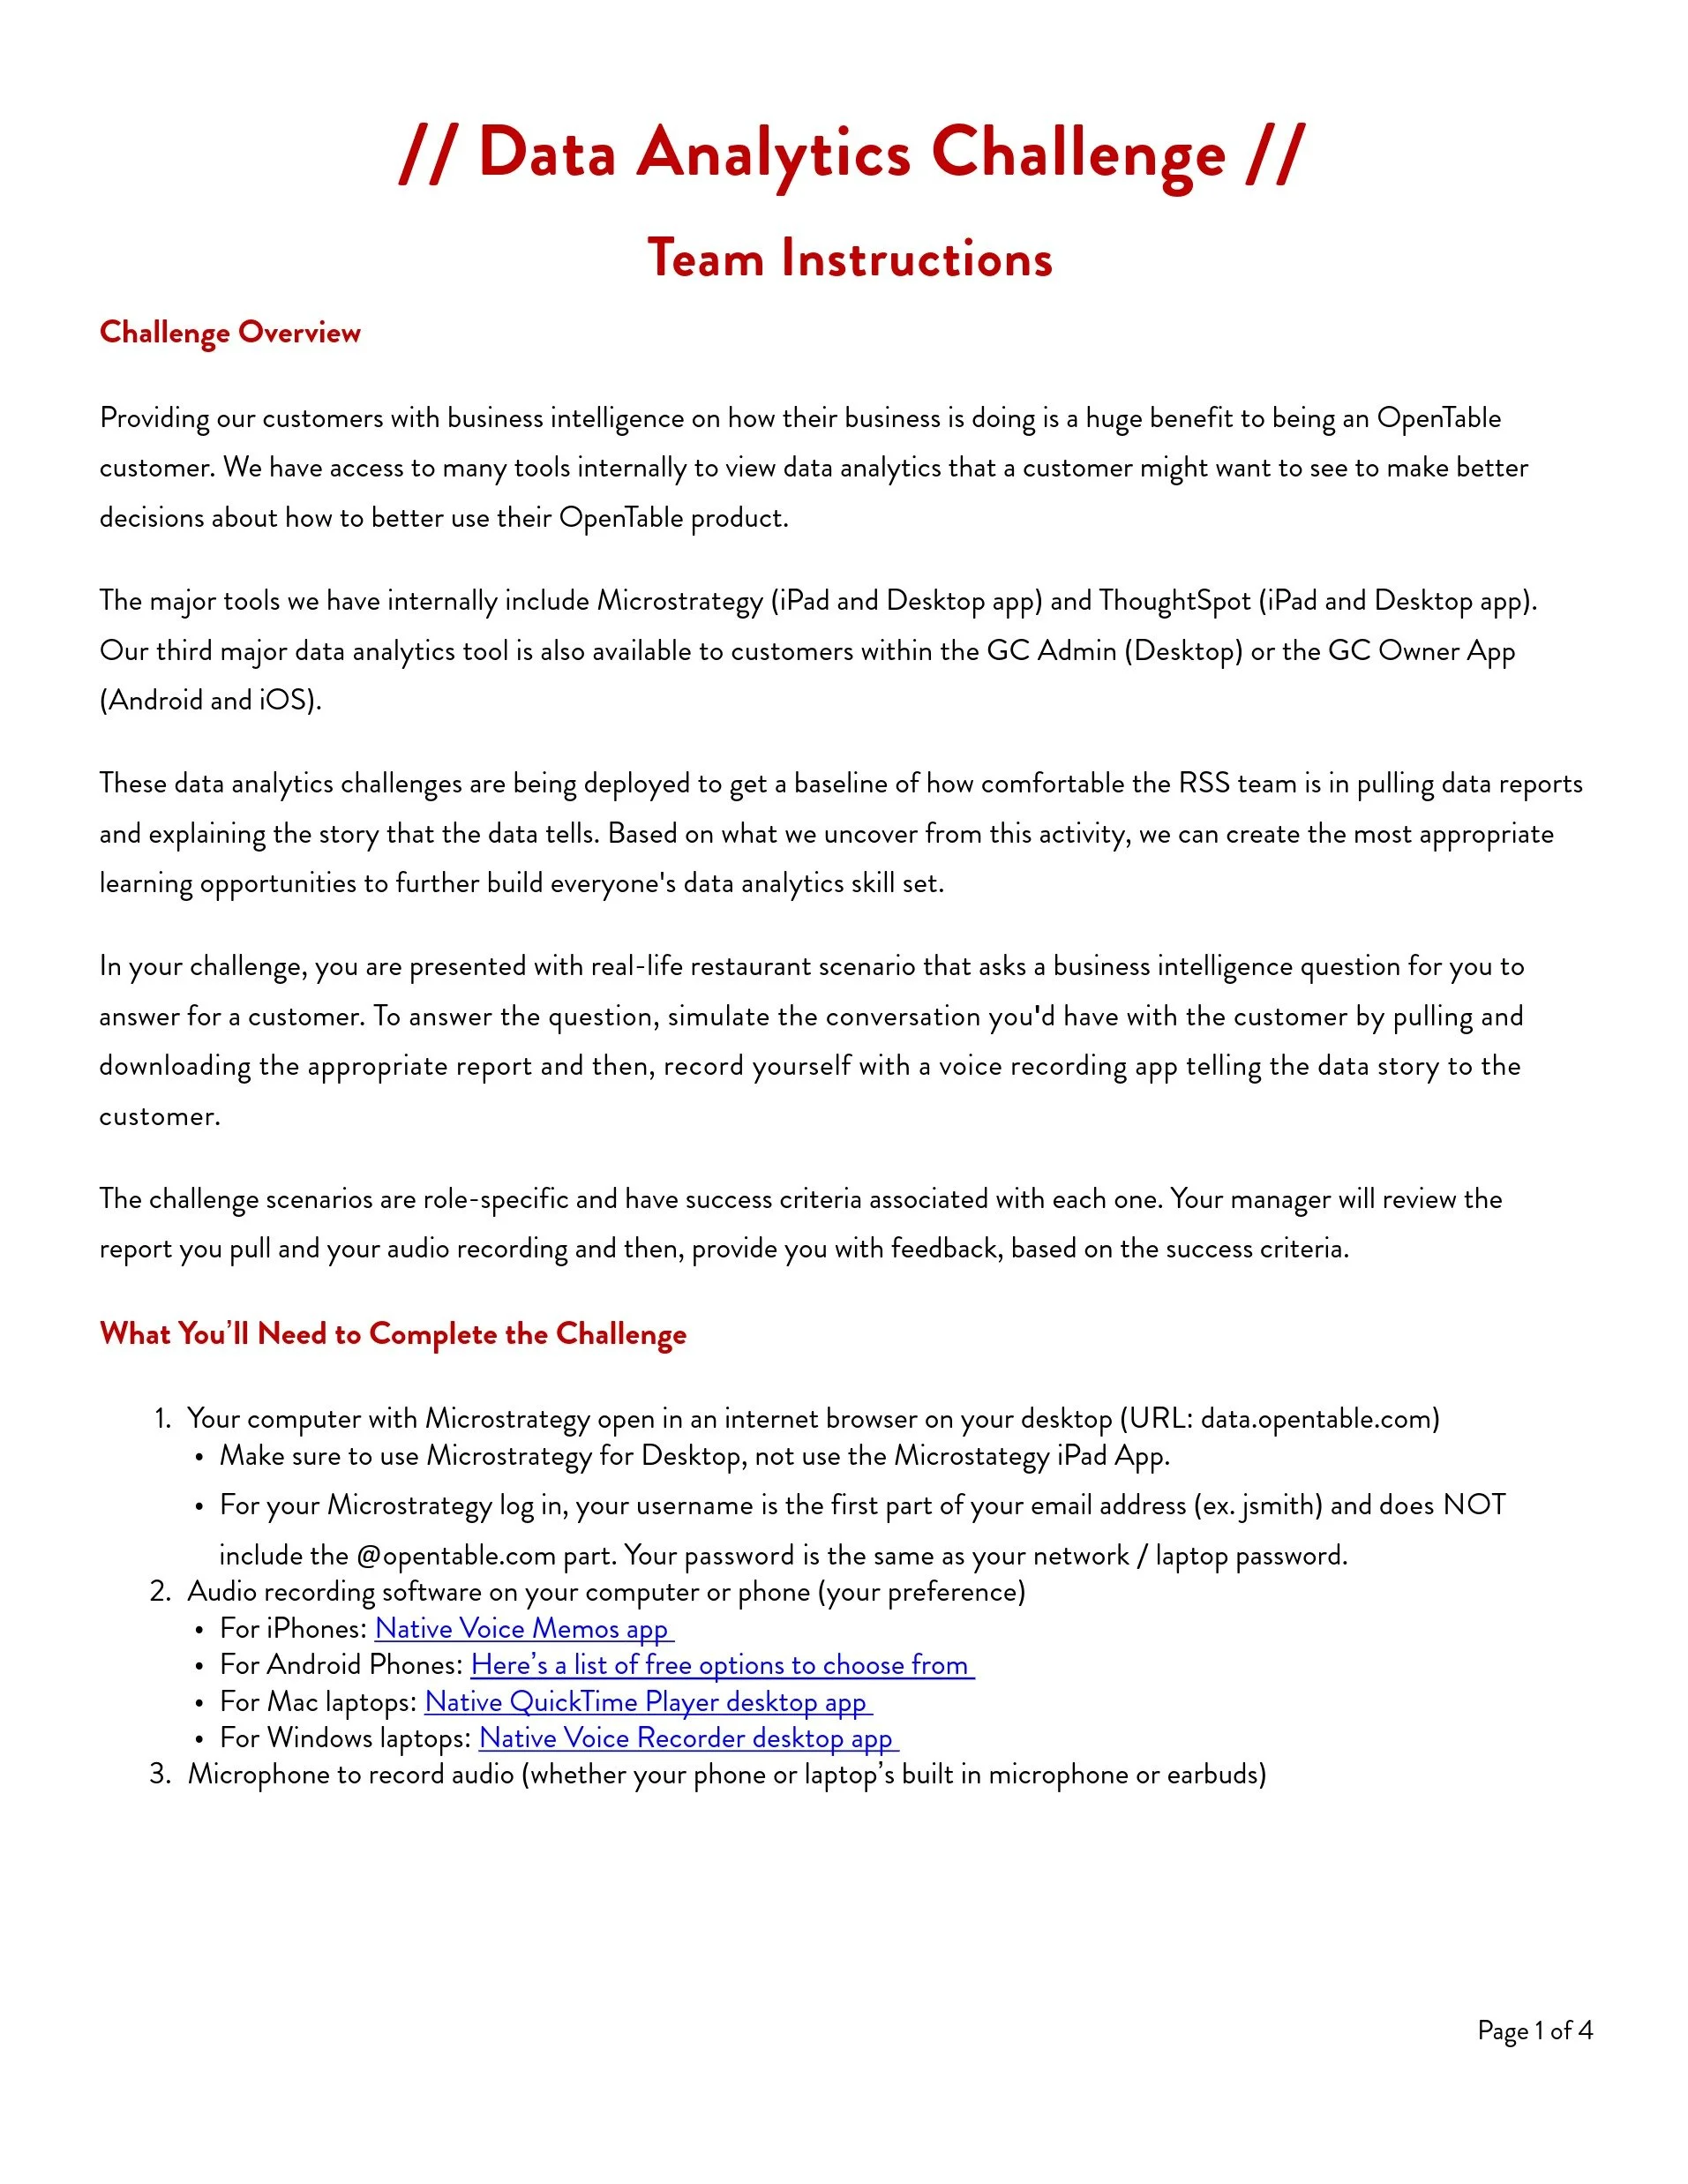
I created a data analytics skills benchmarking program that blended self-assessment, real-world scenarios, and coaching feedback to drive measurable performance improvement.
Self-assessment: Sales and services team members evaluated their comfort with available BI tools, identifying individual development needs.
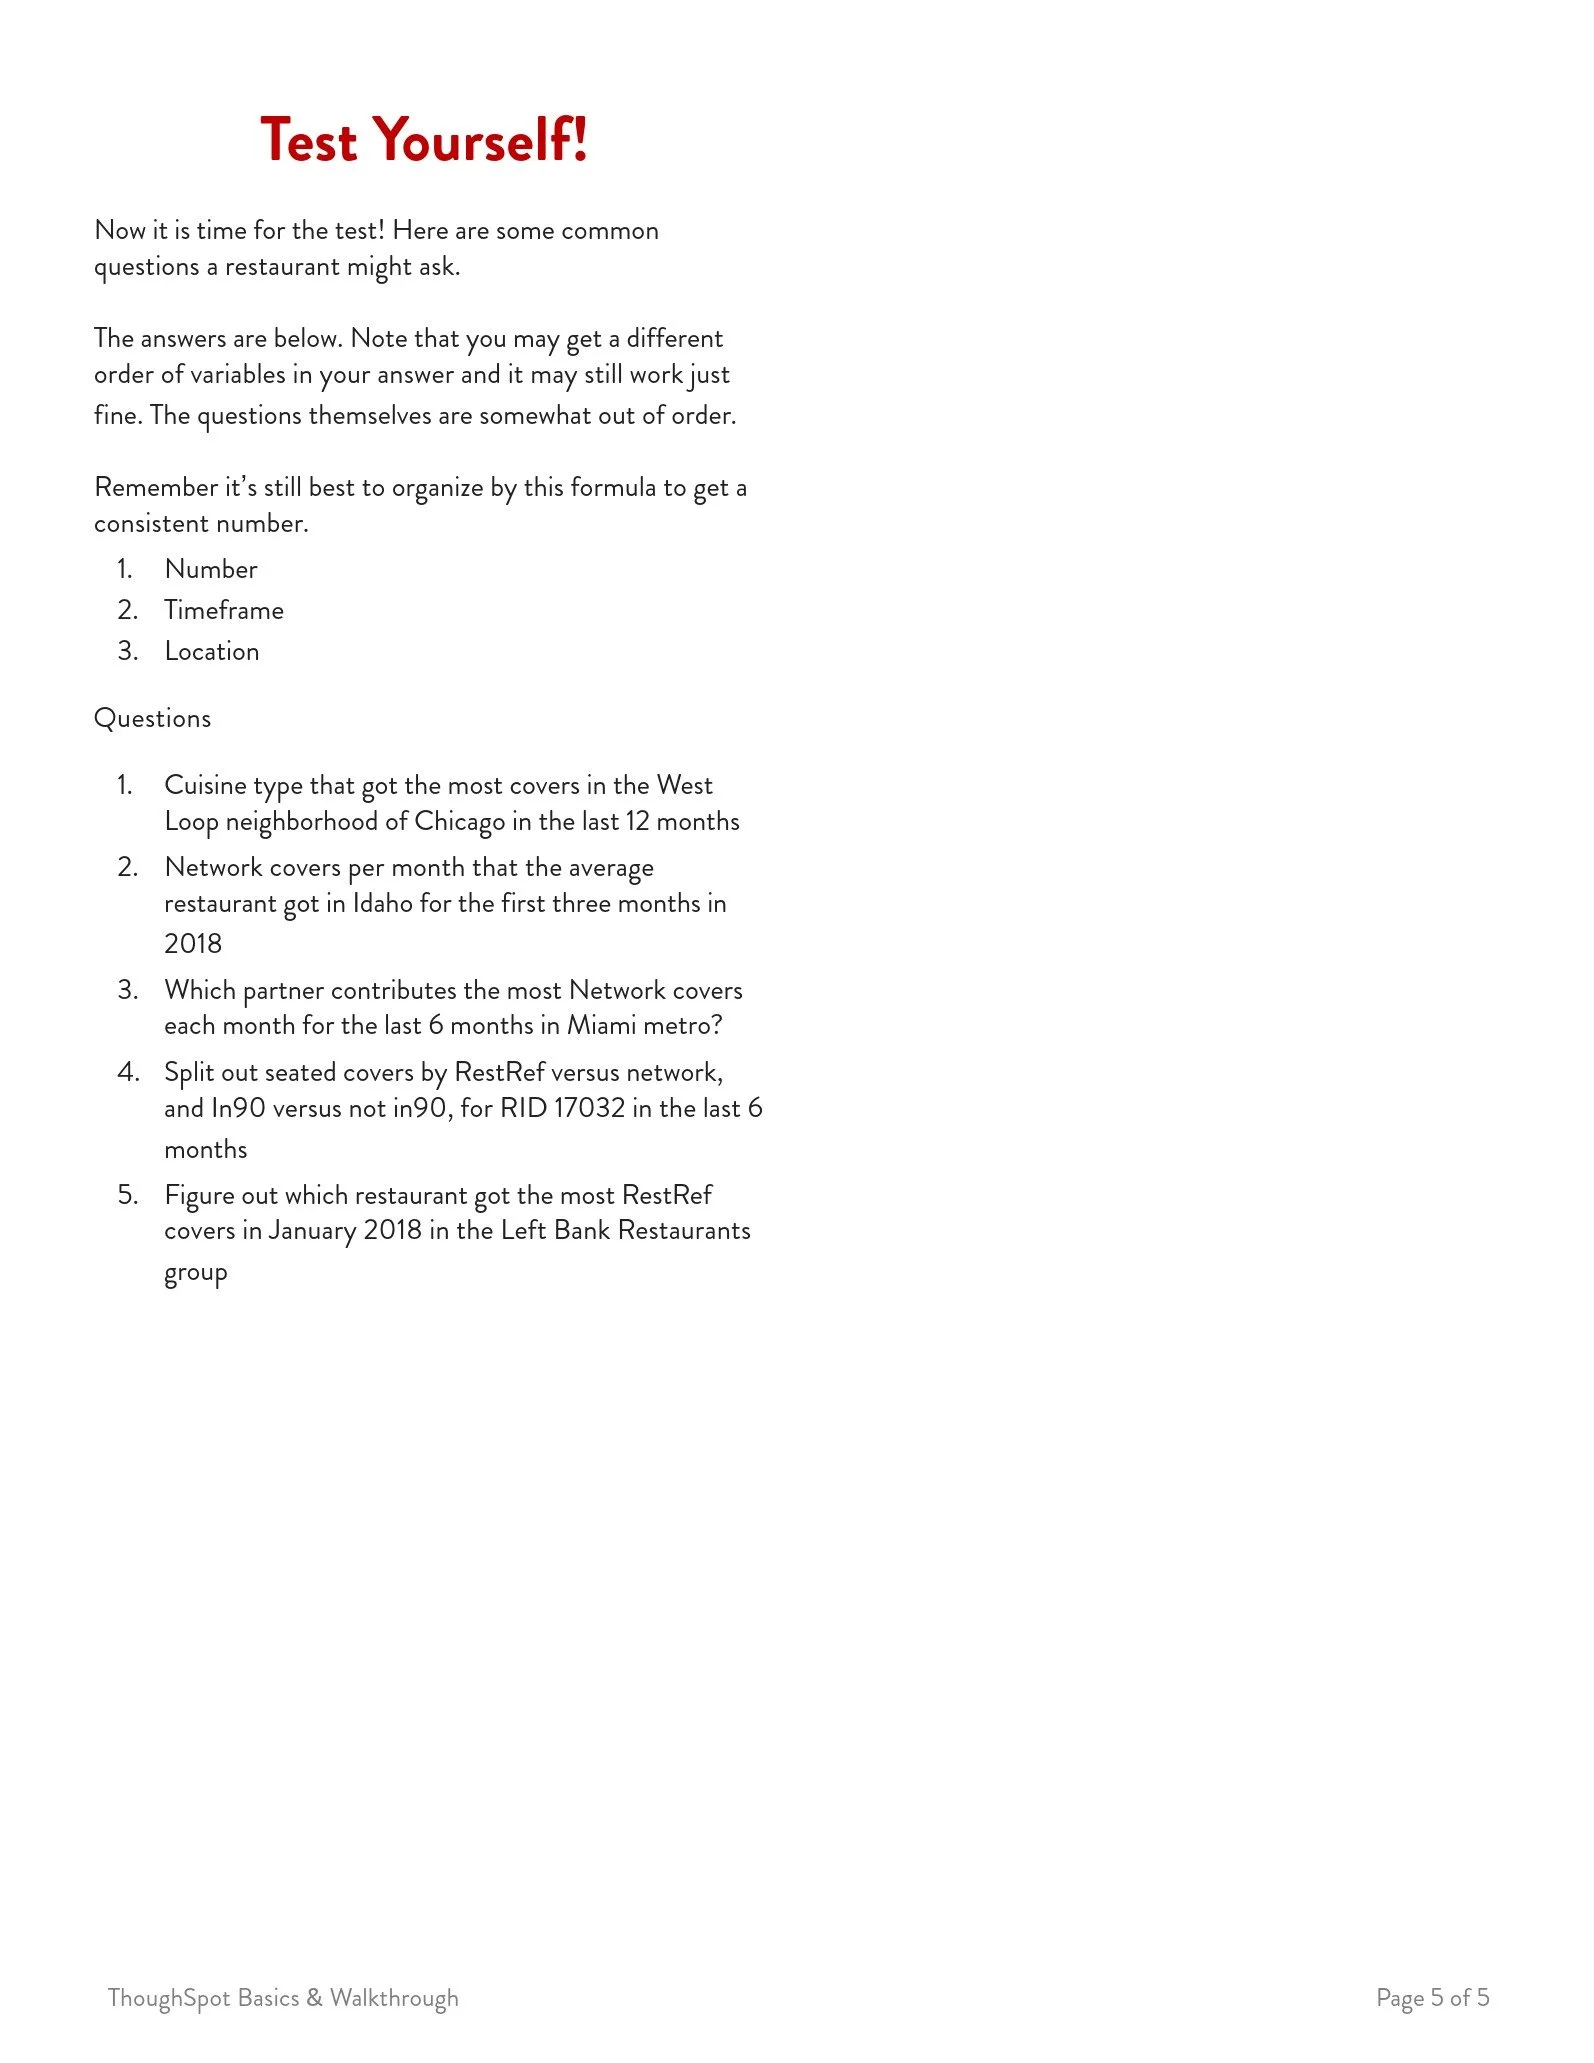
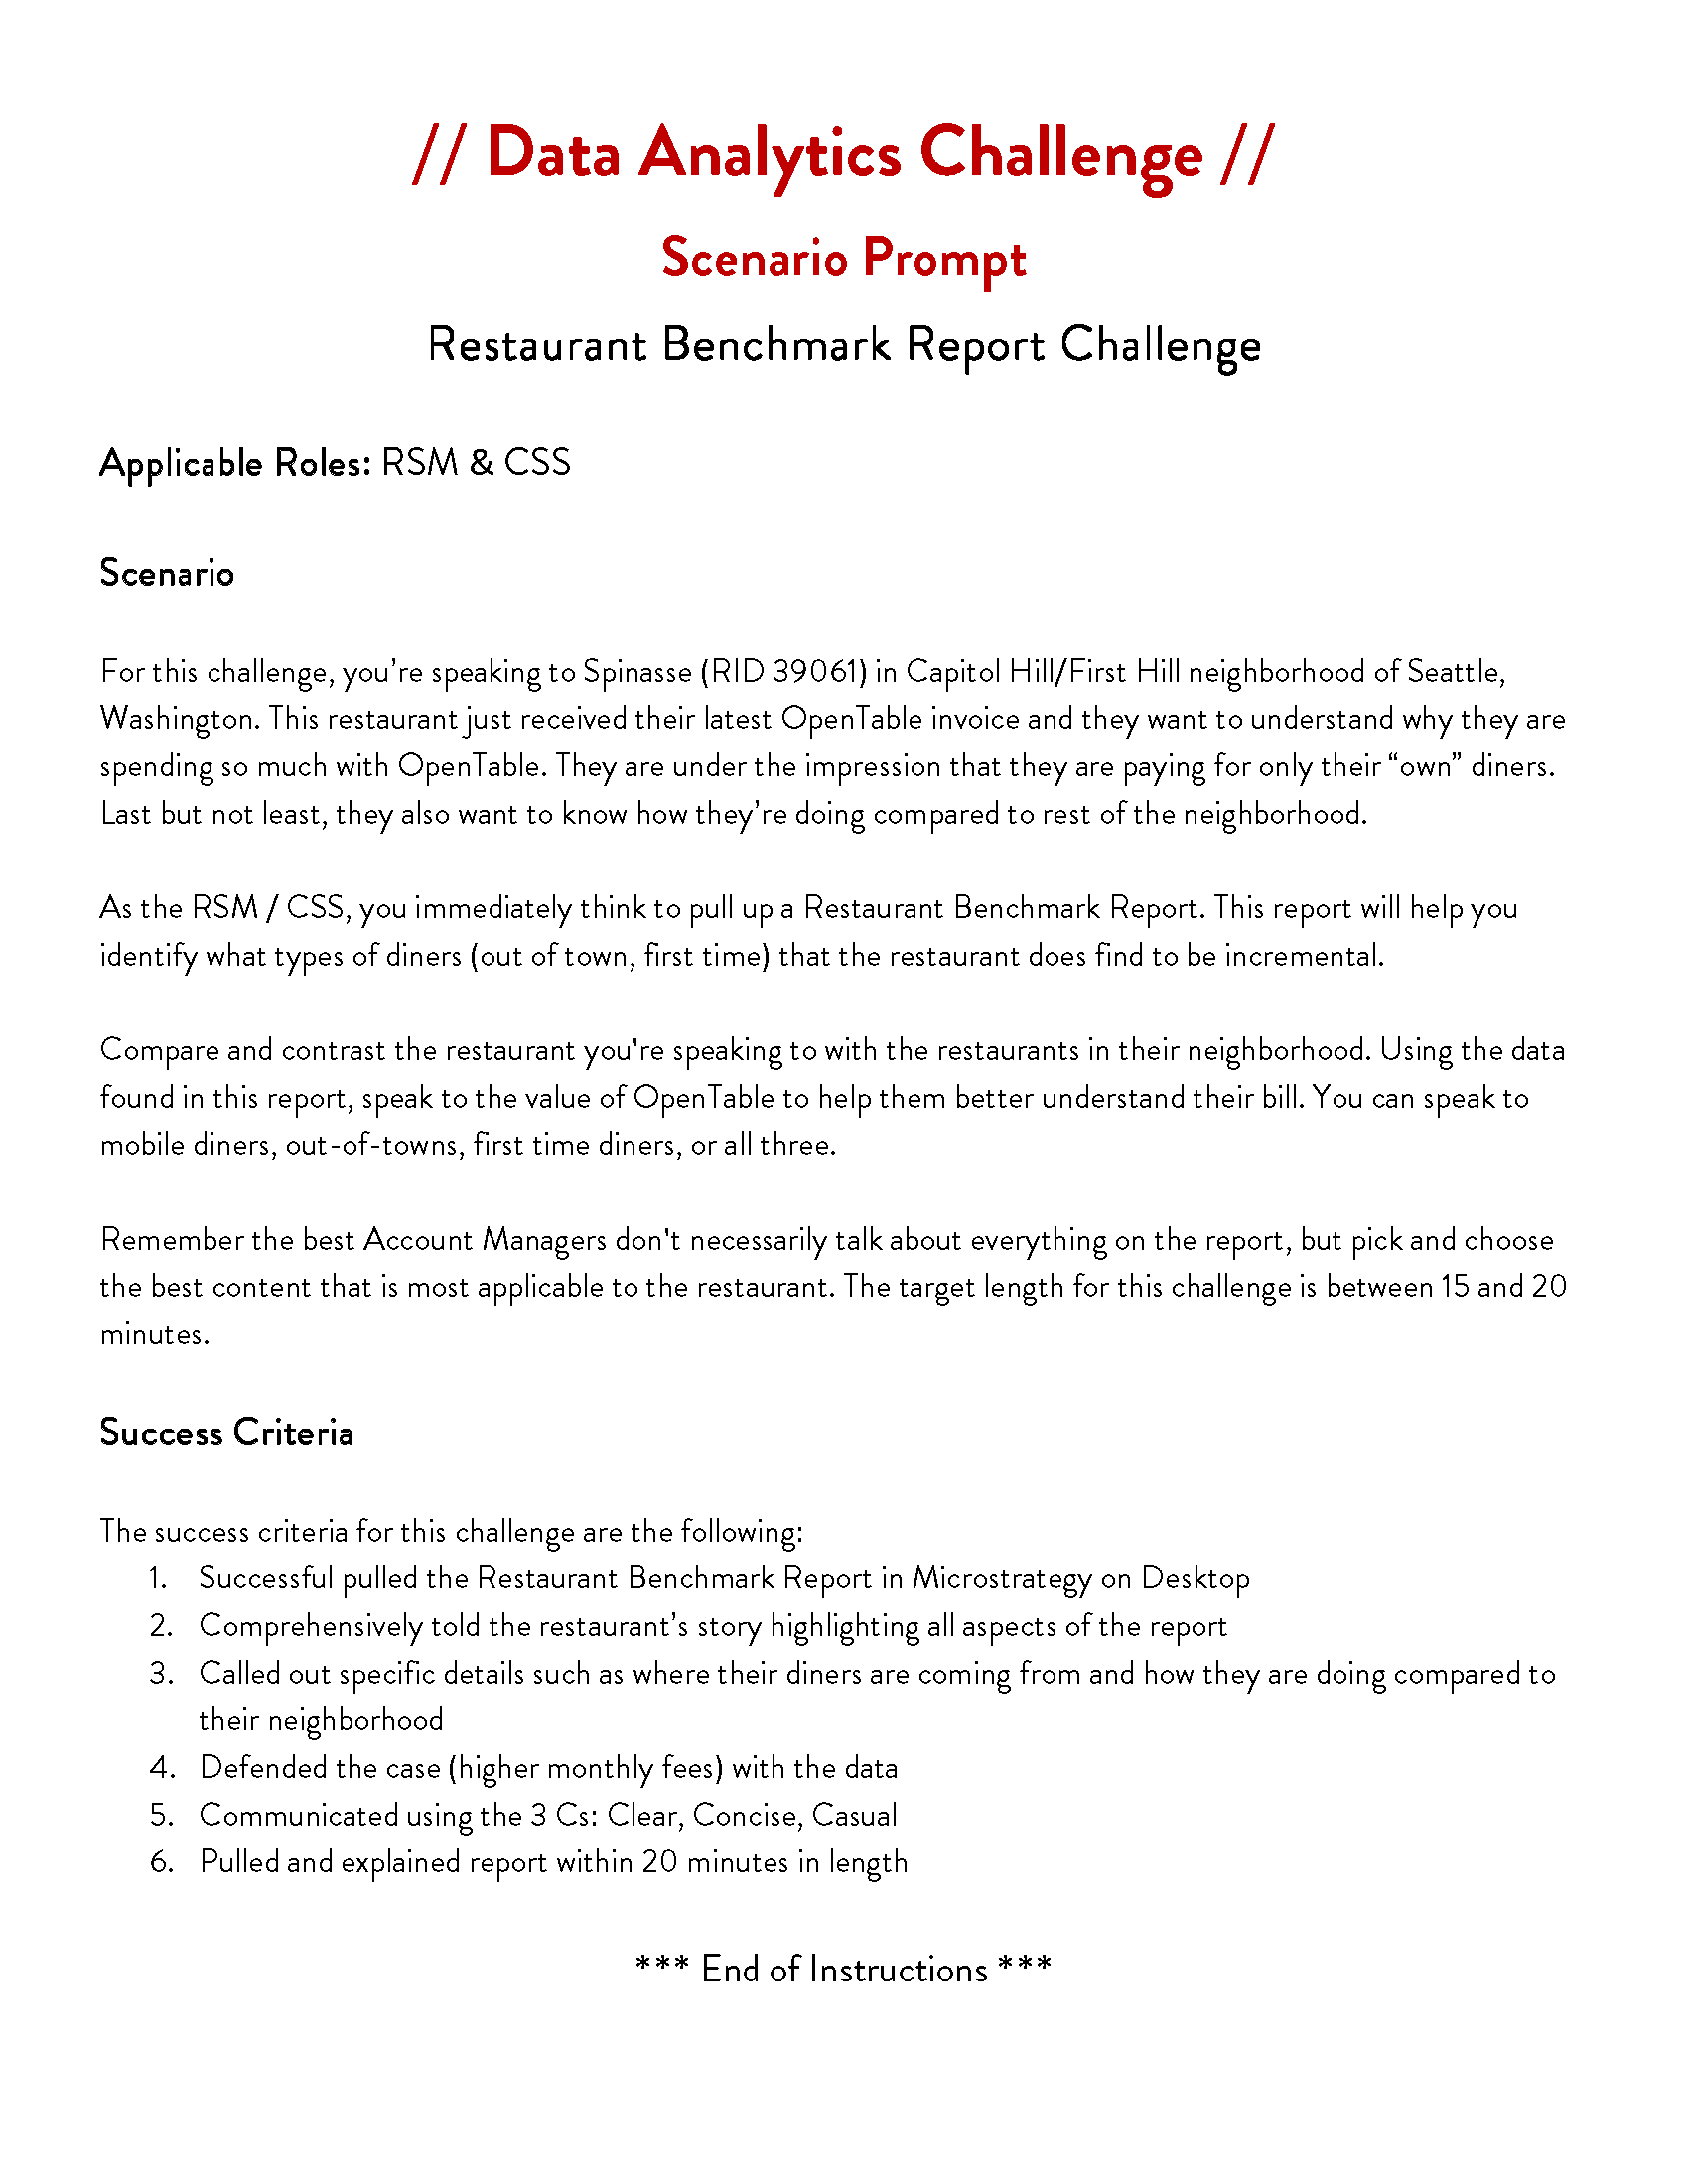
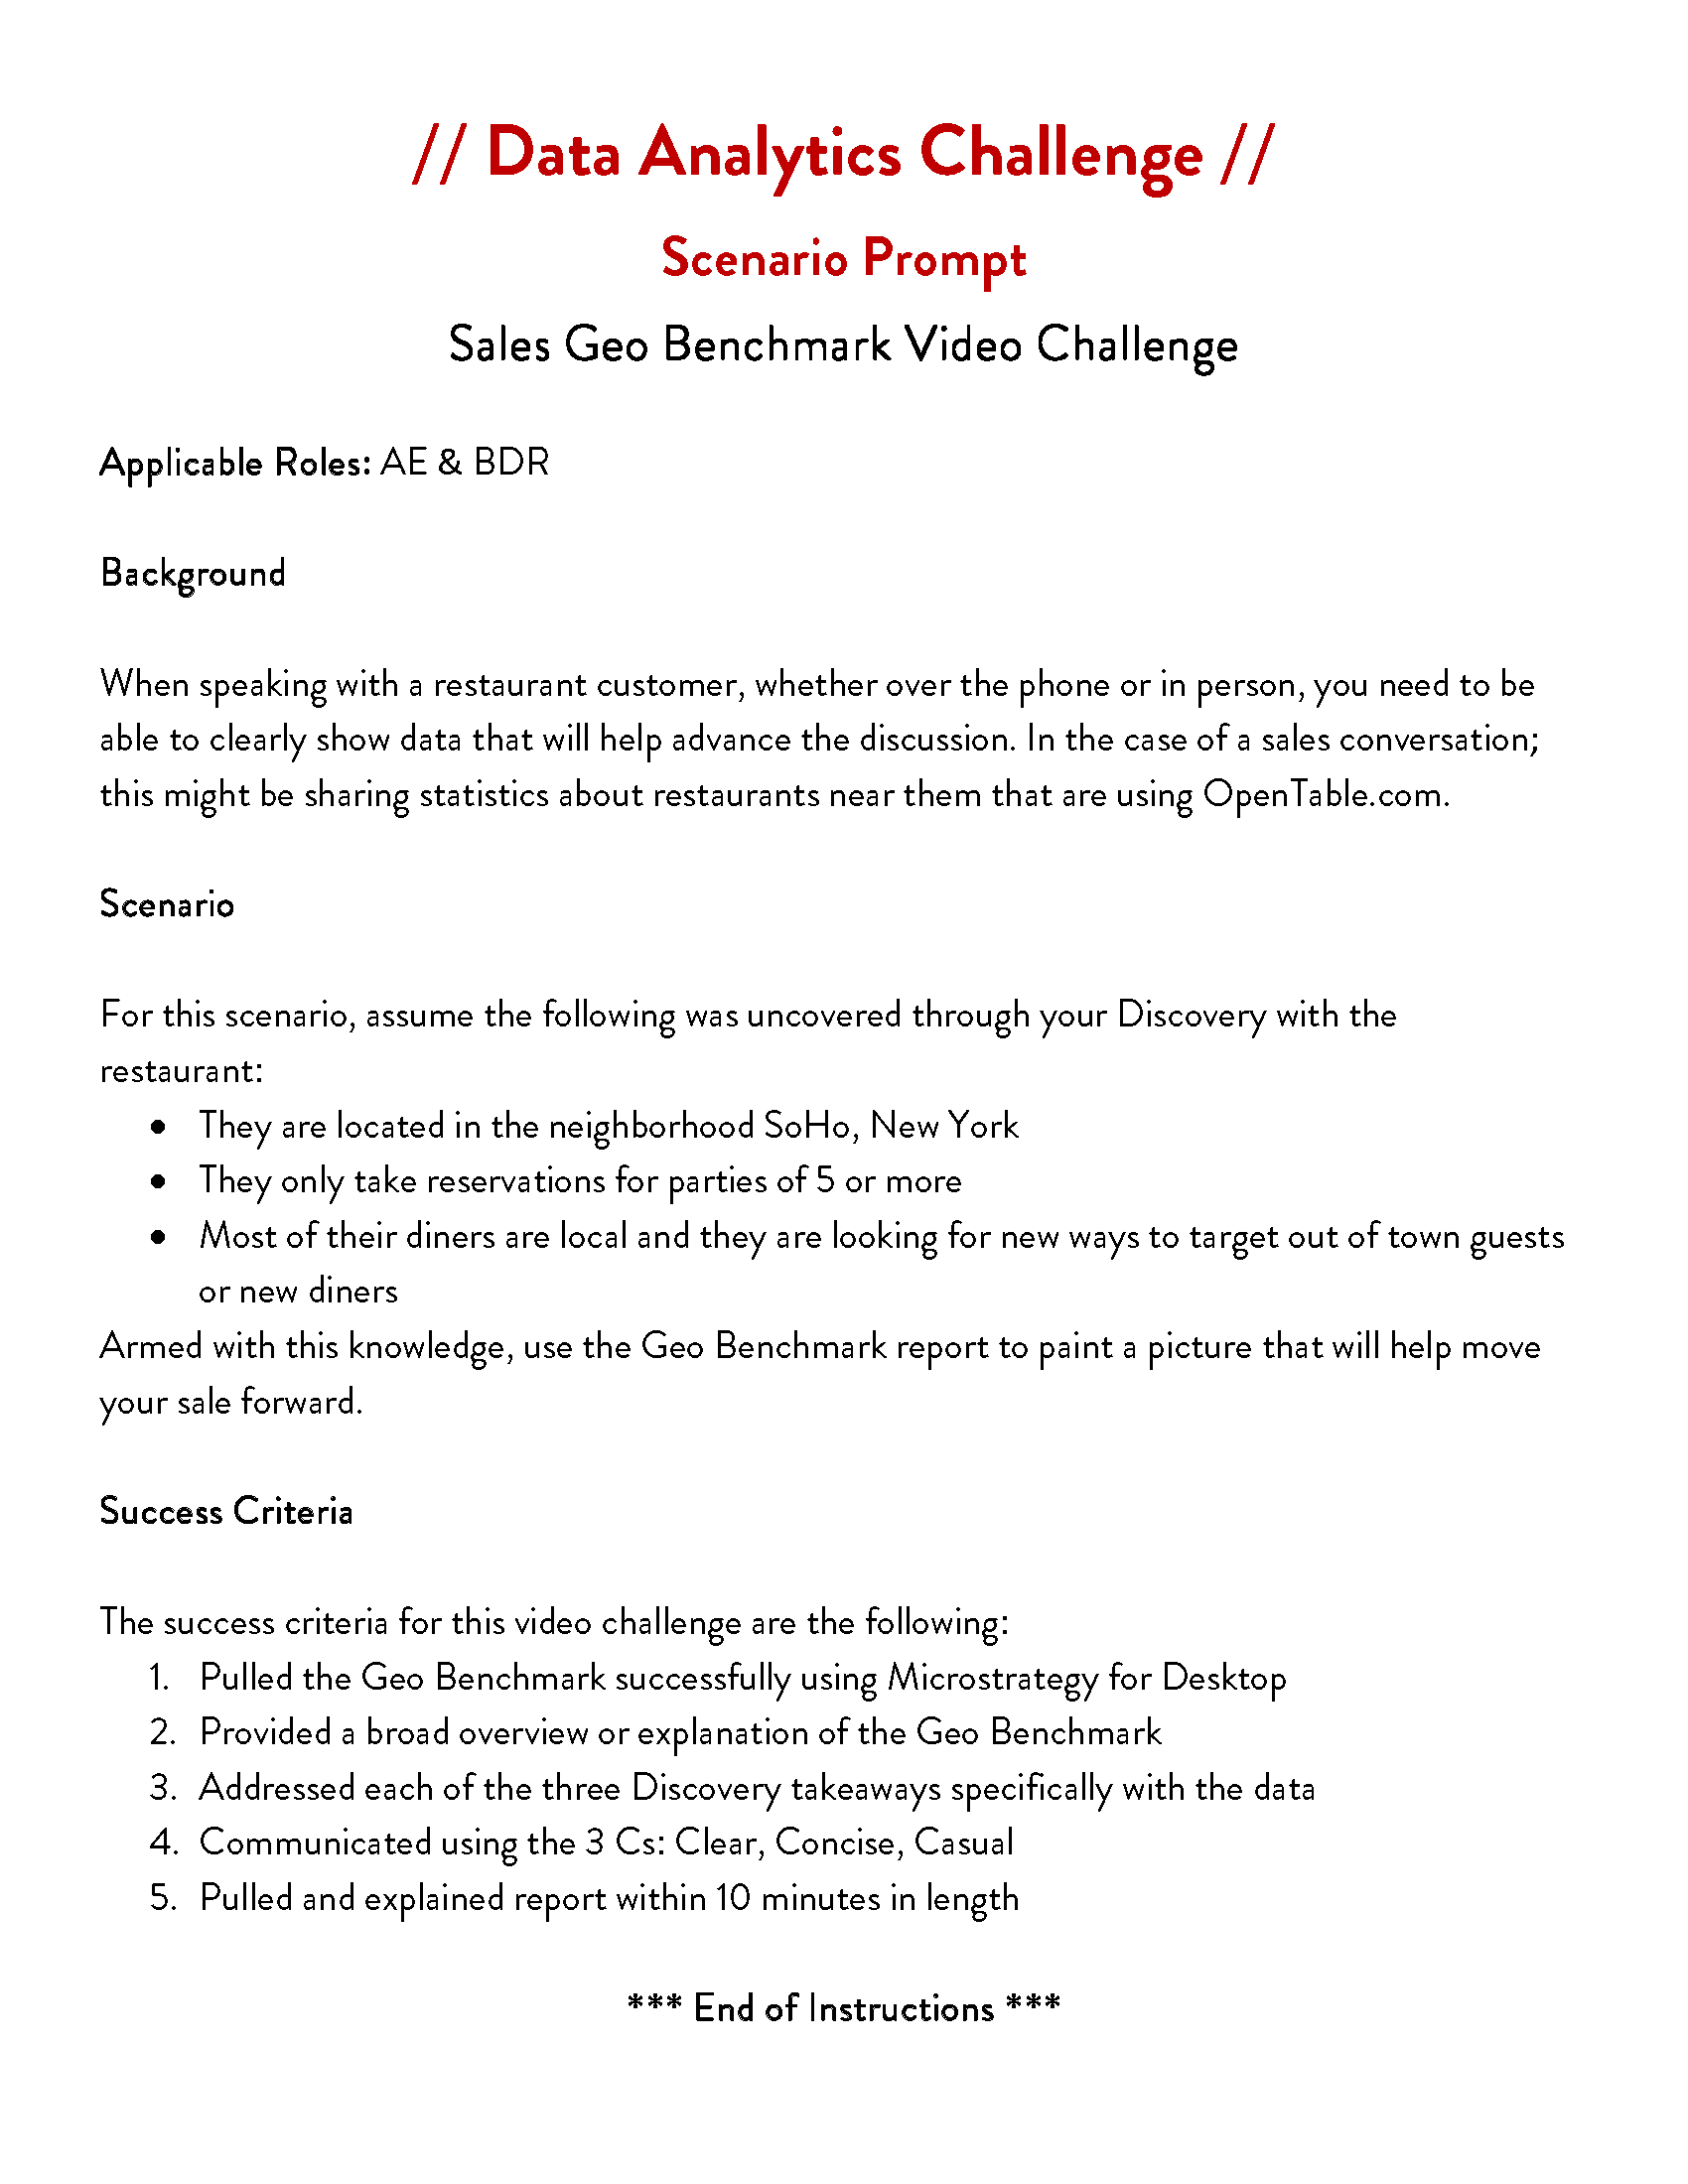
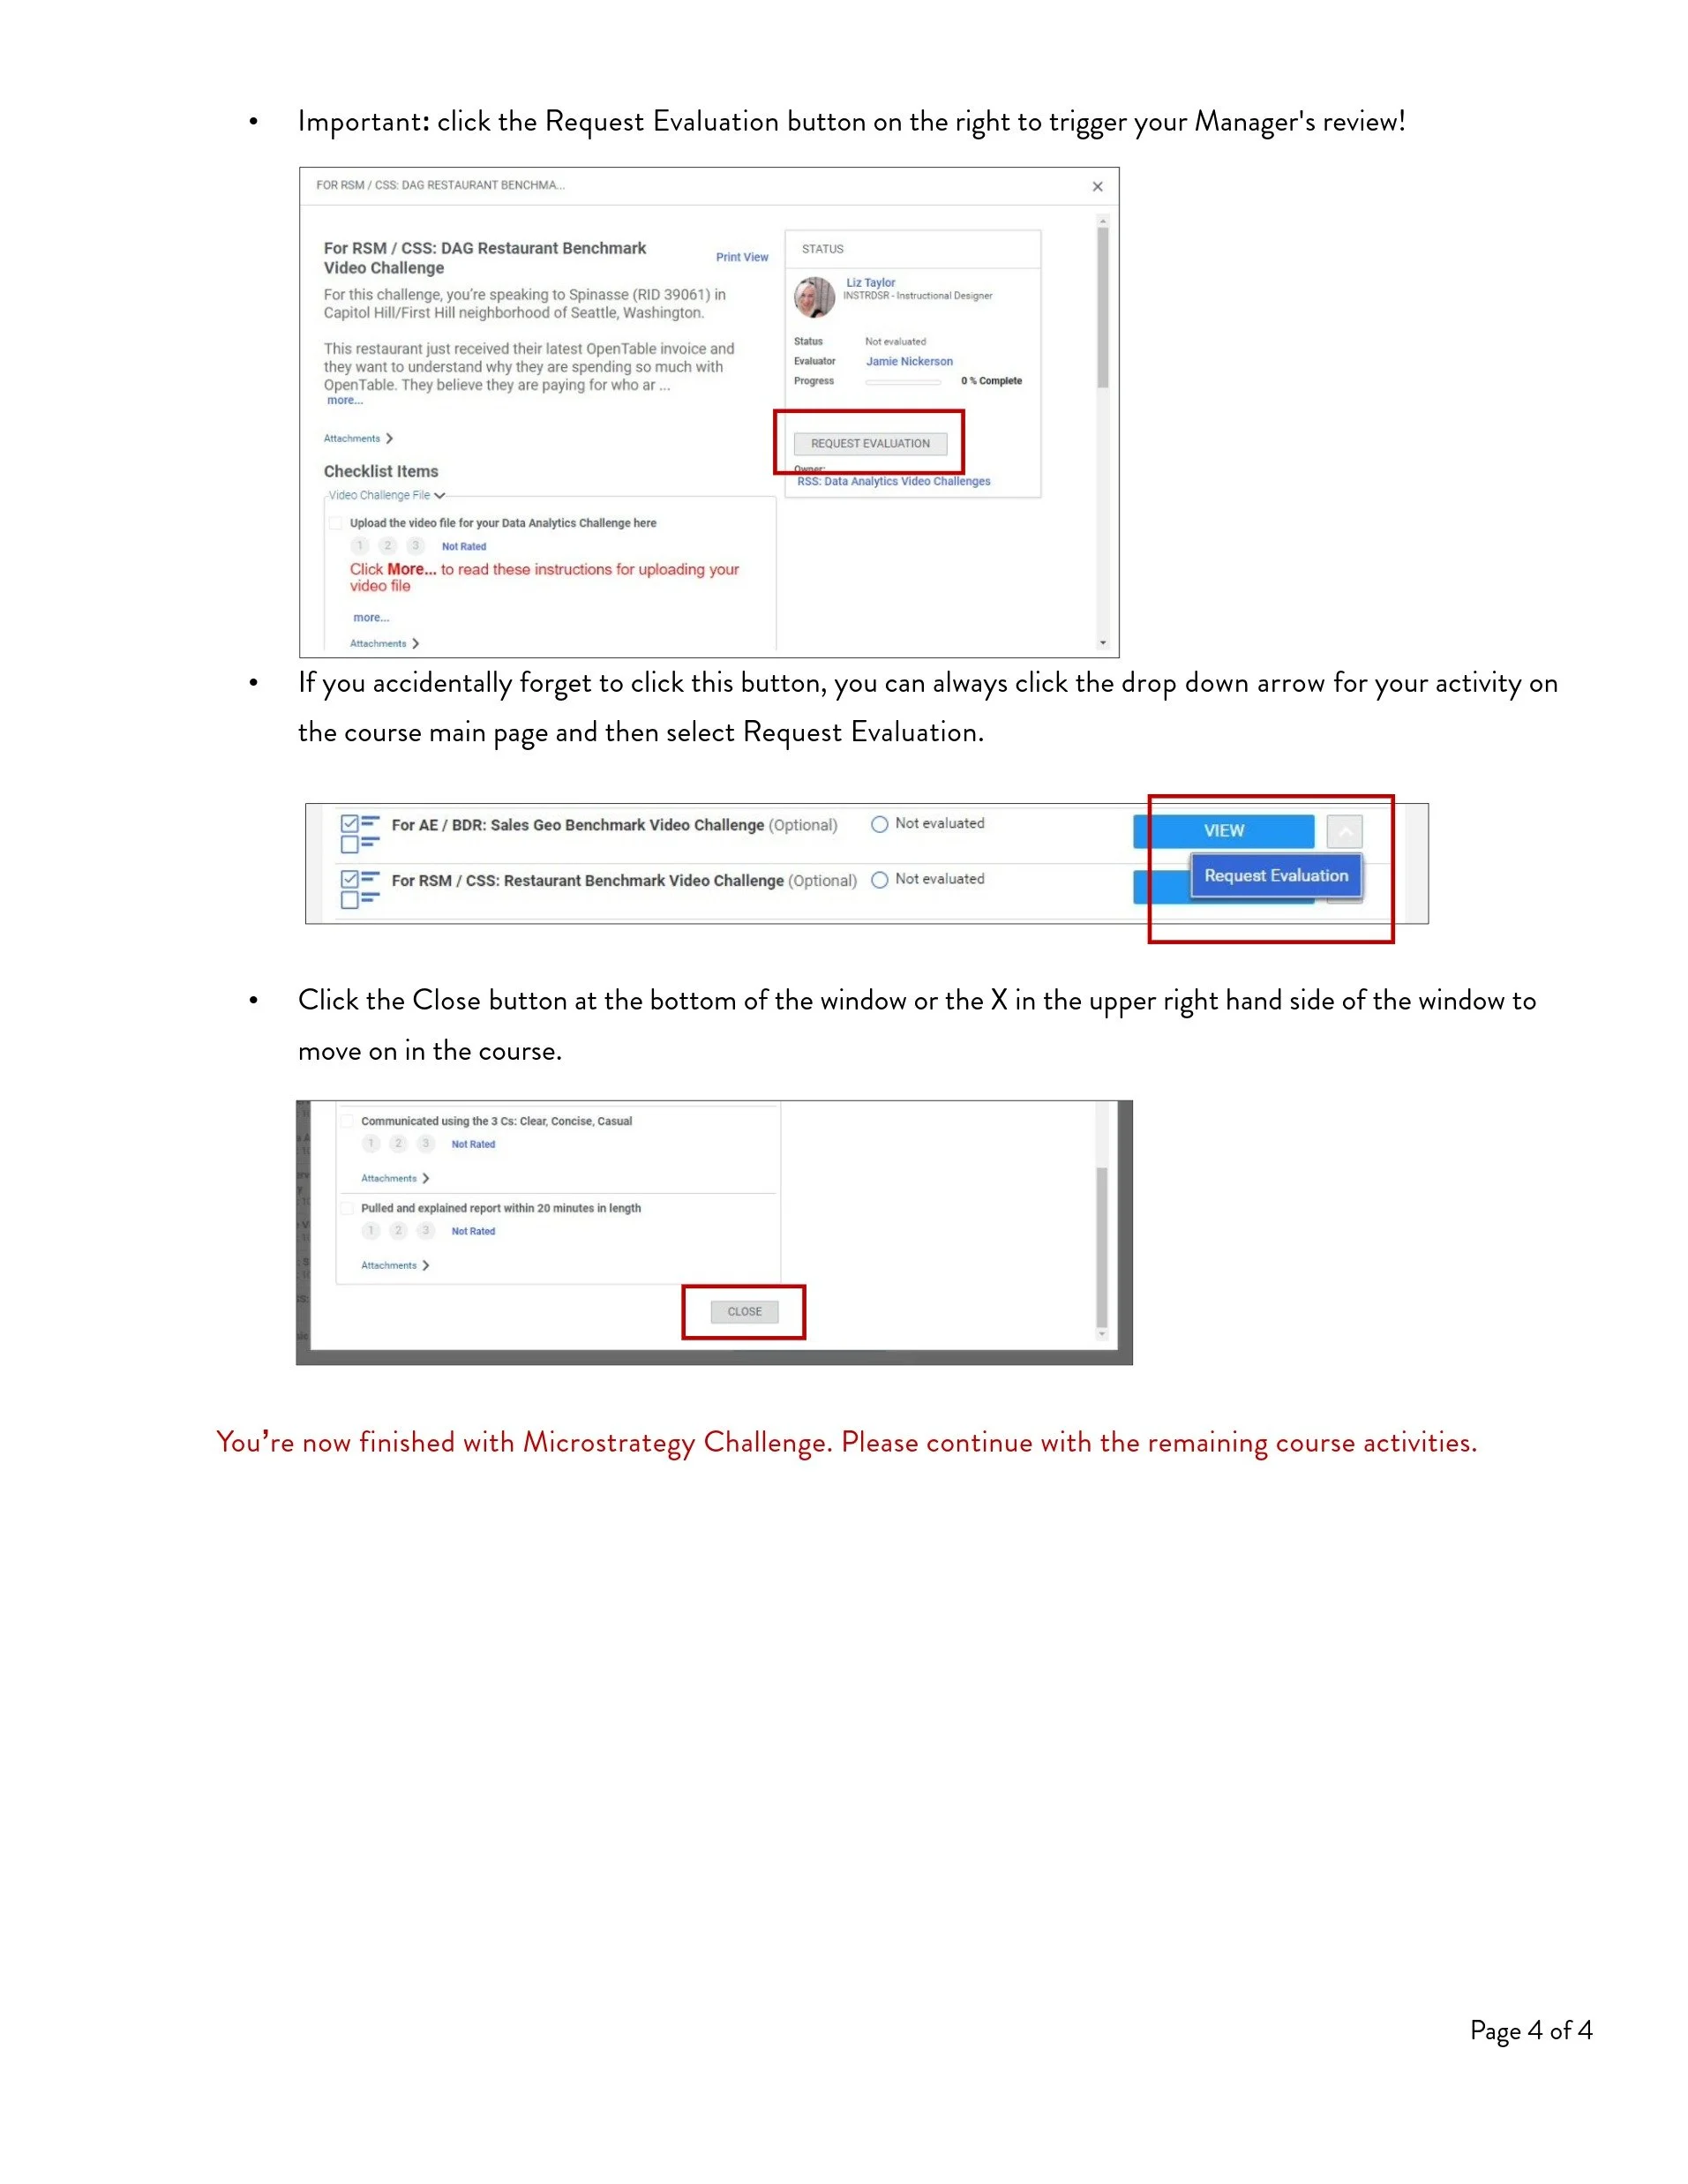
Scenario-based challenges: Participants analyzed actual reports and role-played customer conversations, demonstrating their ability to interpret data and tell compelling stories.
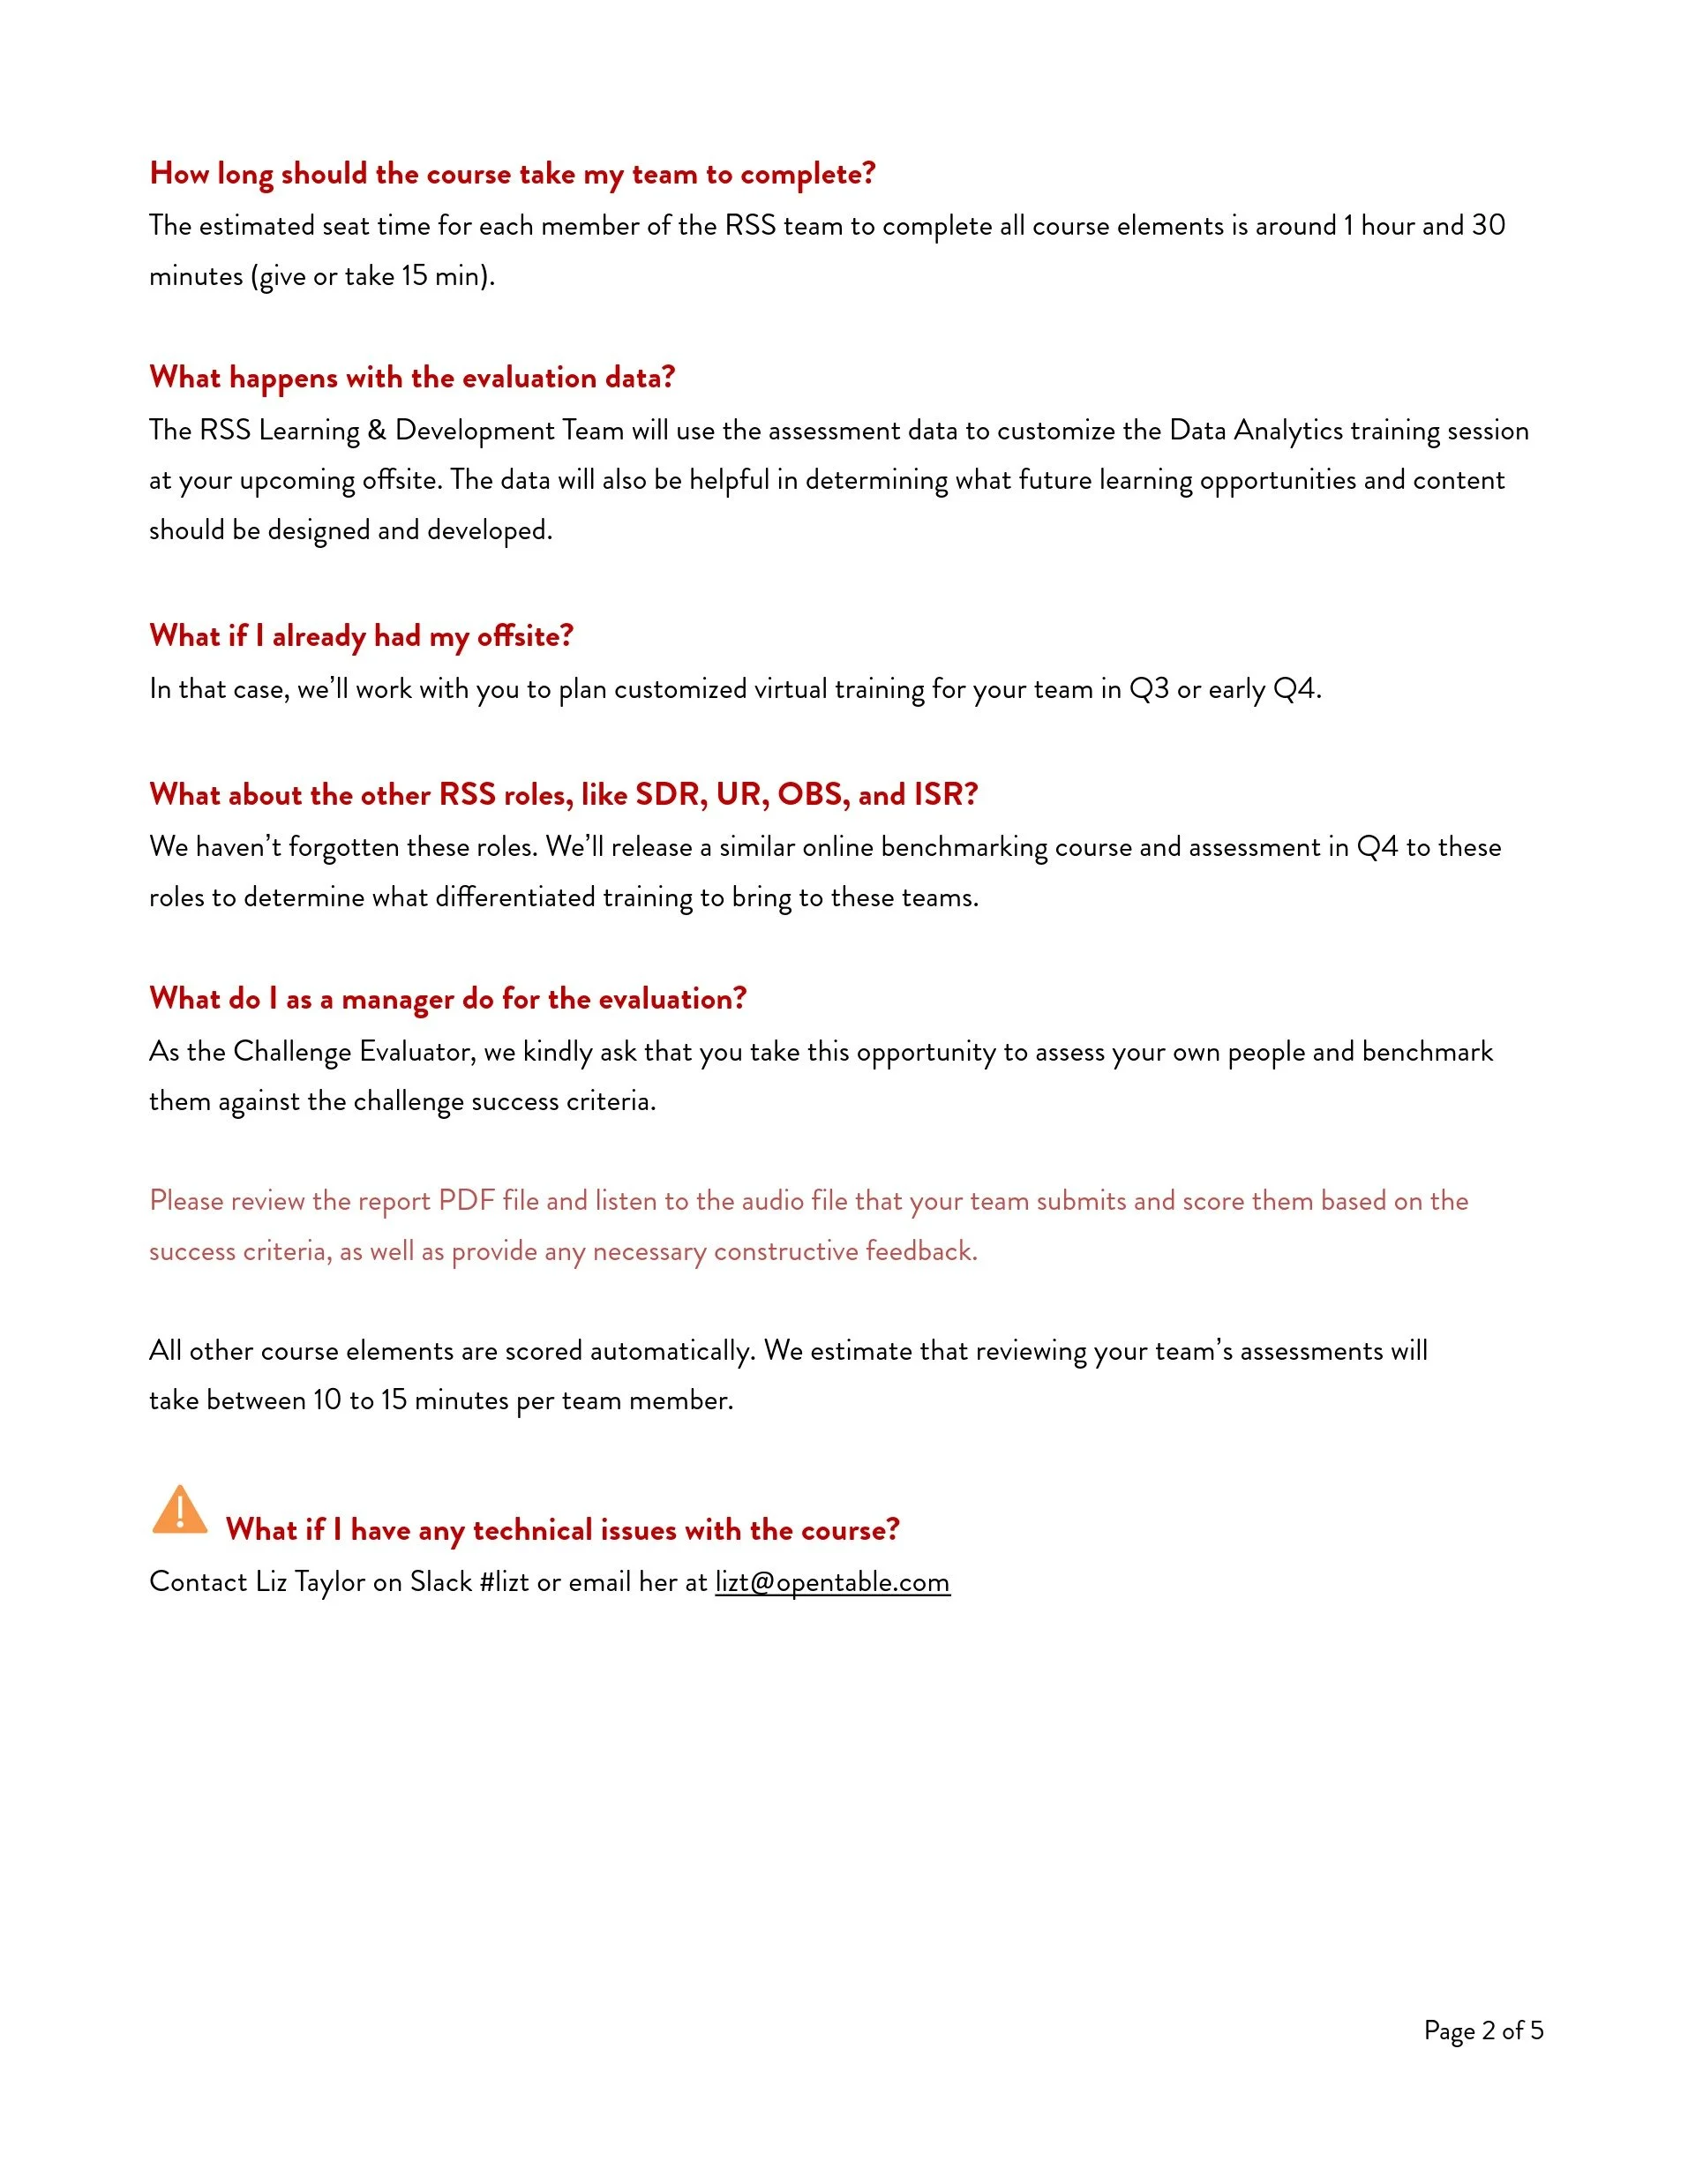
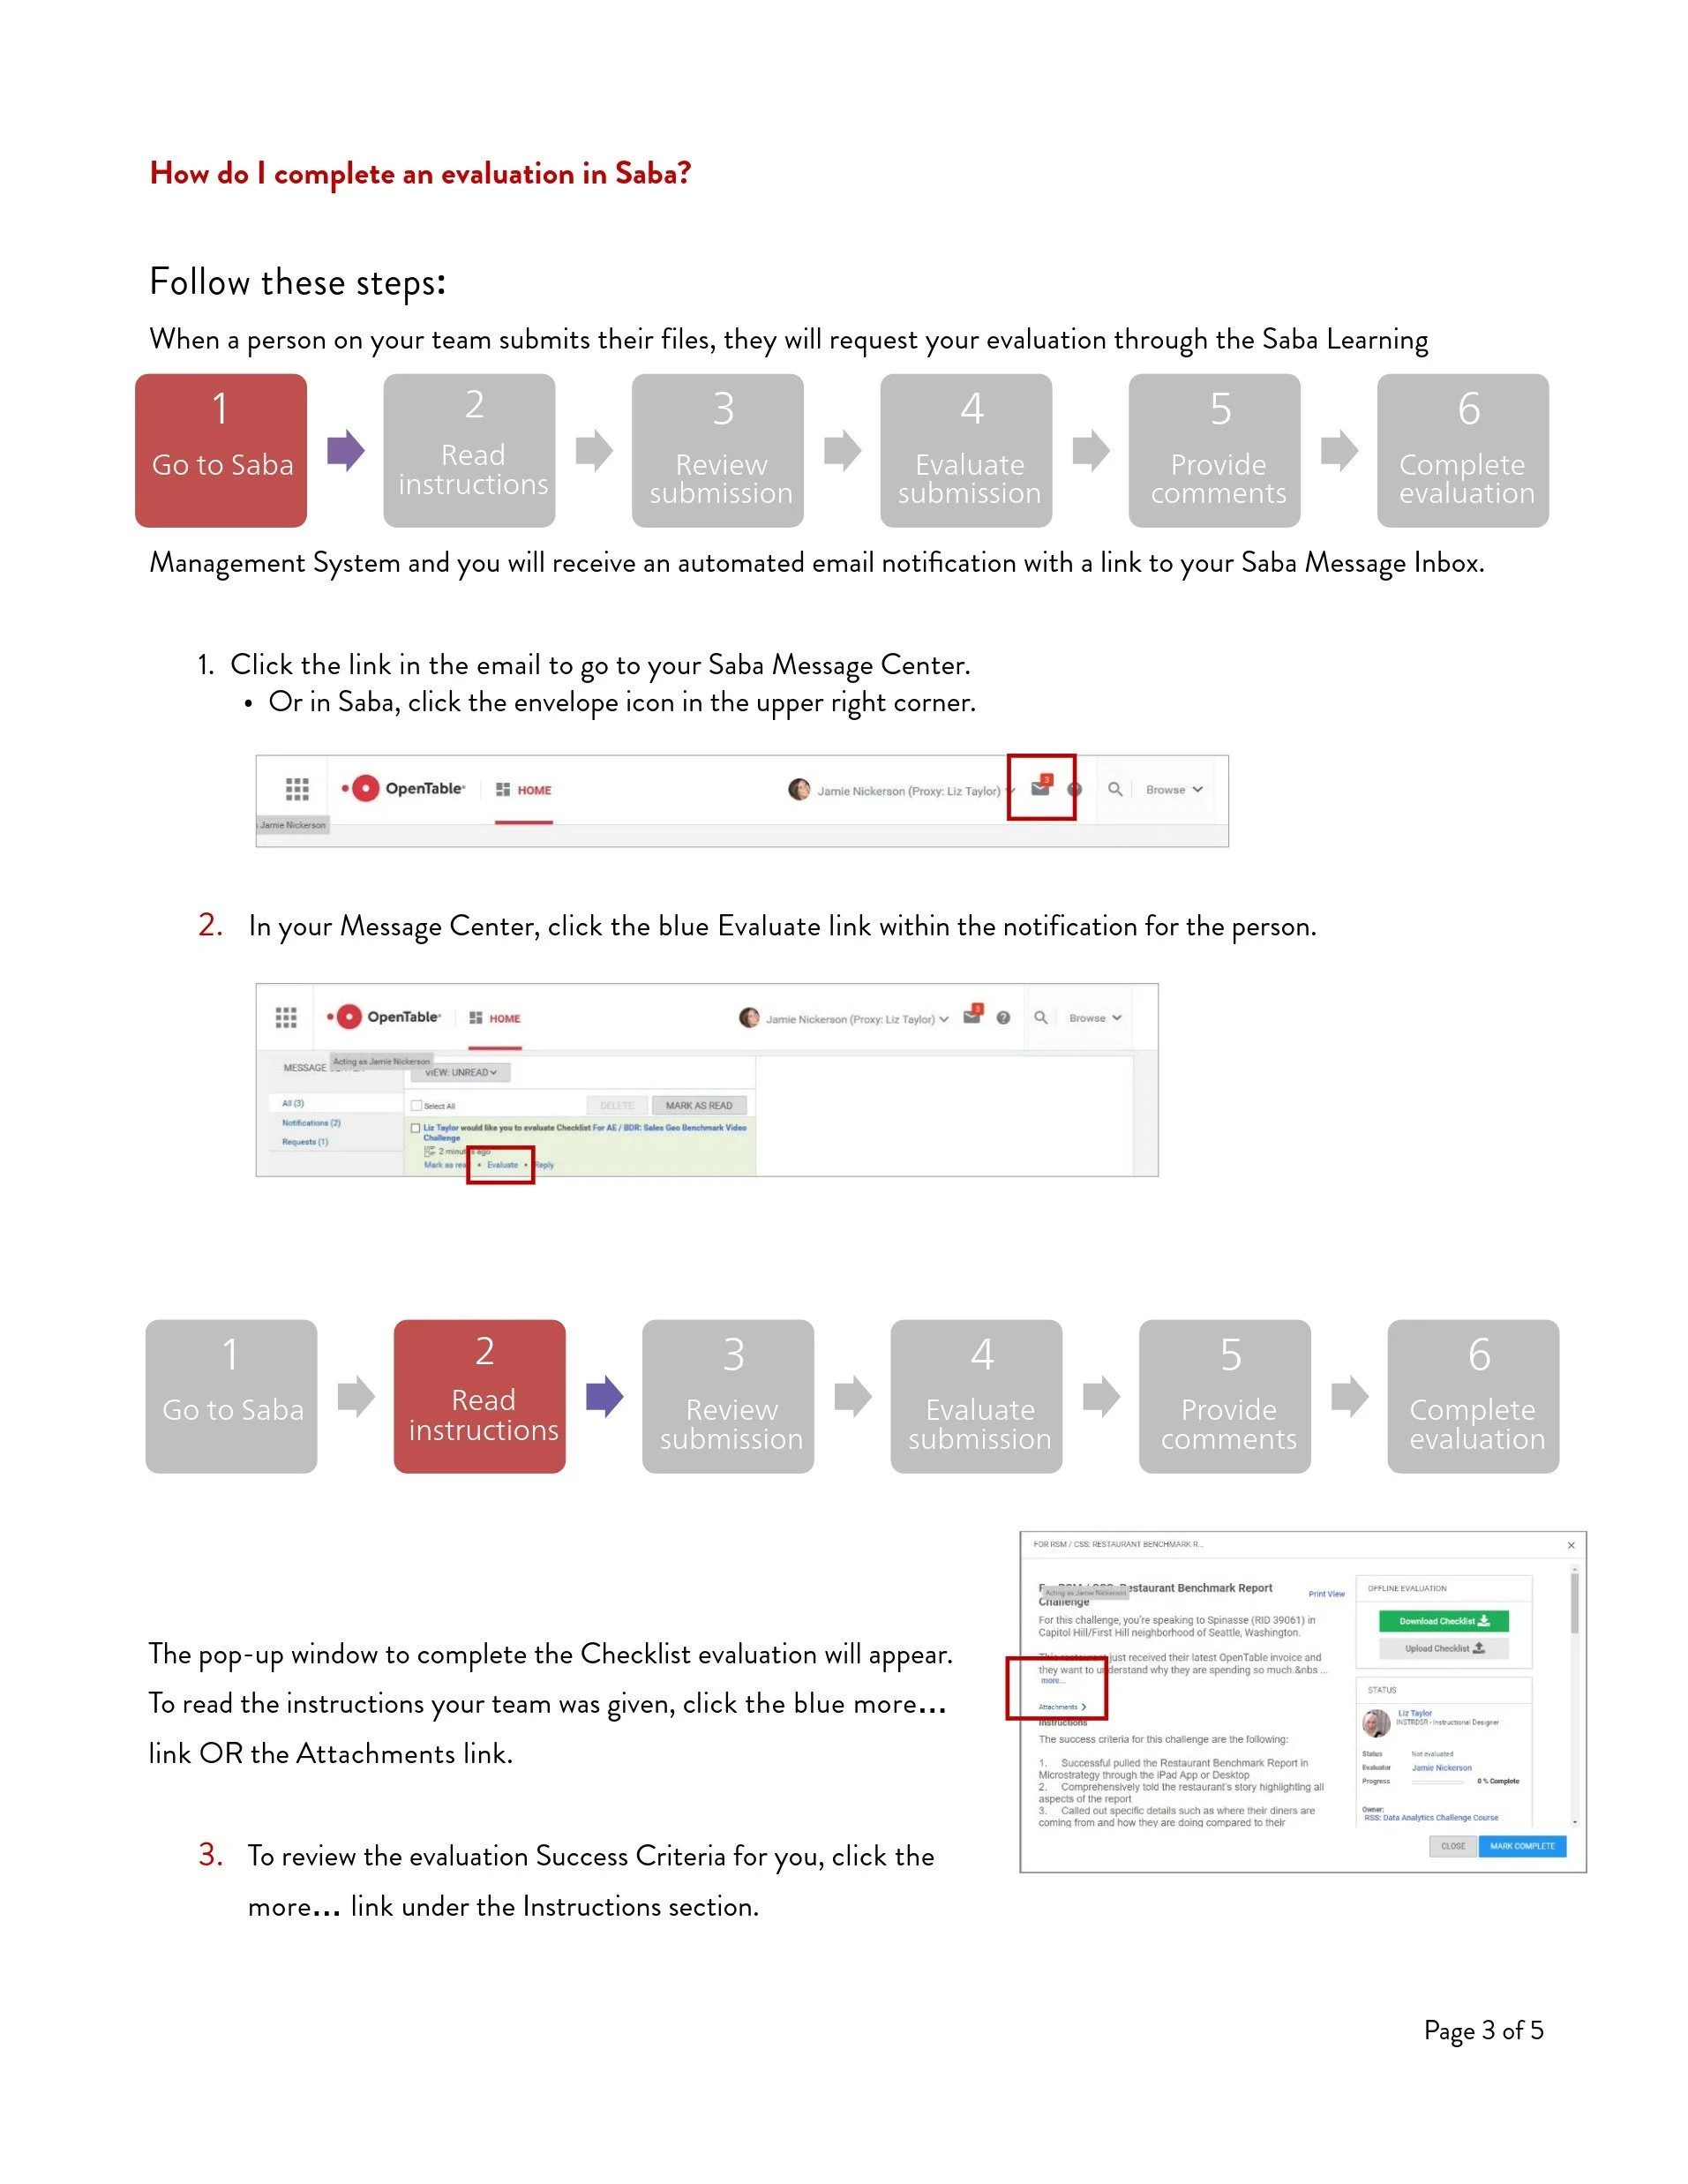
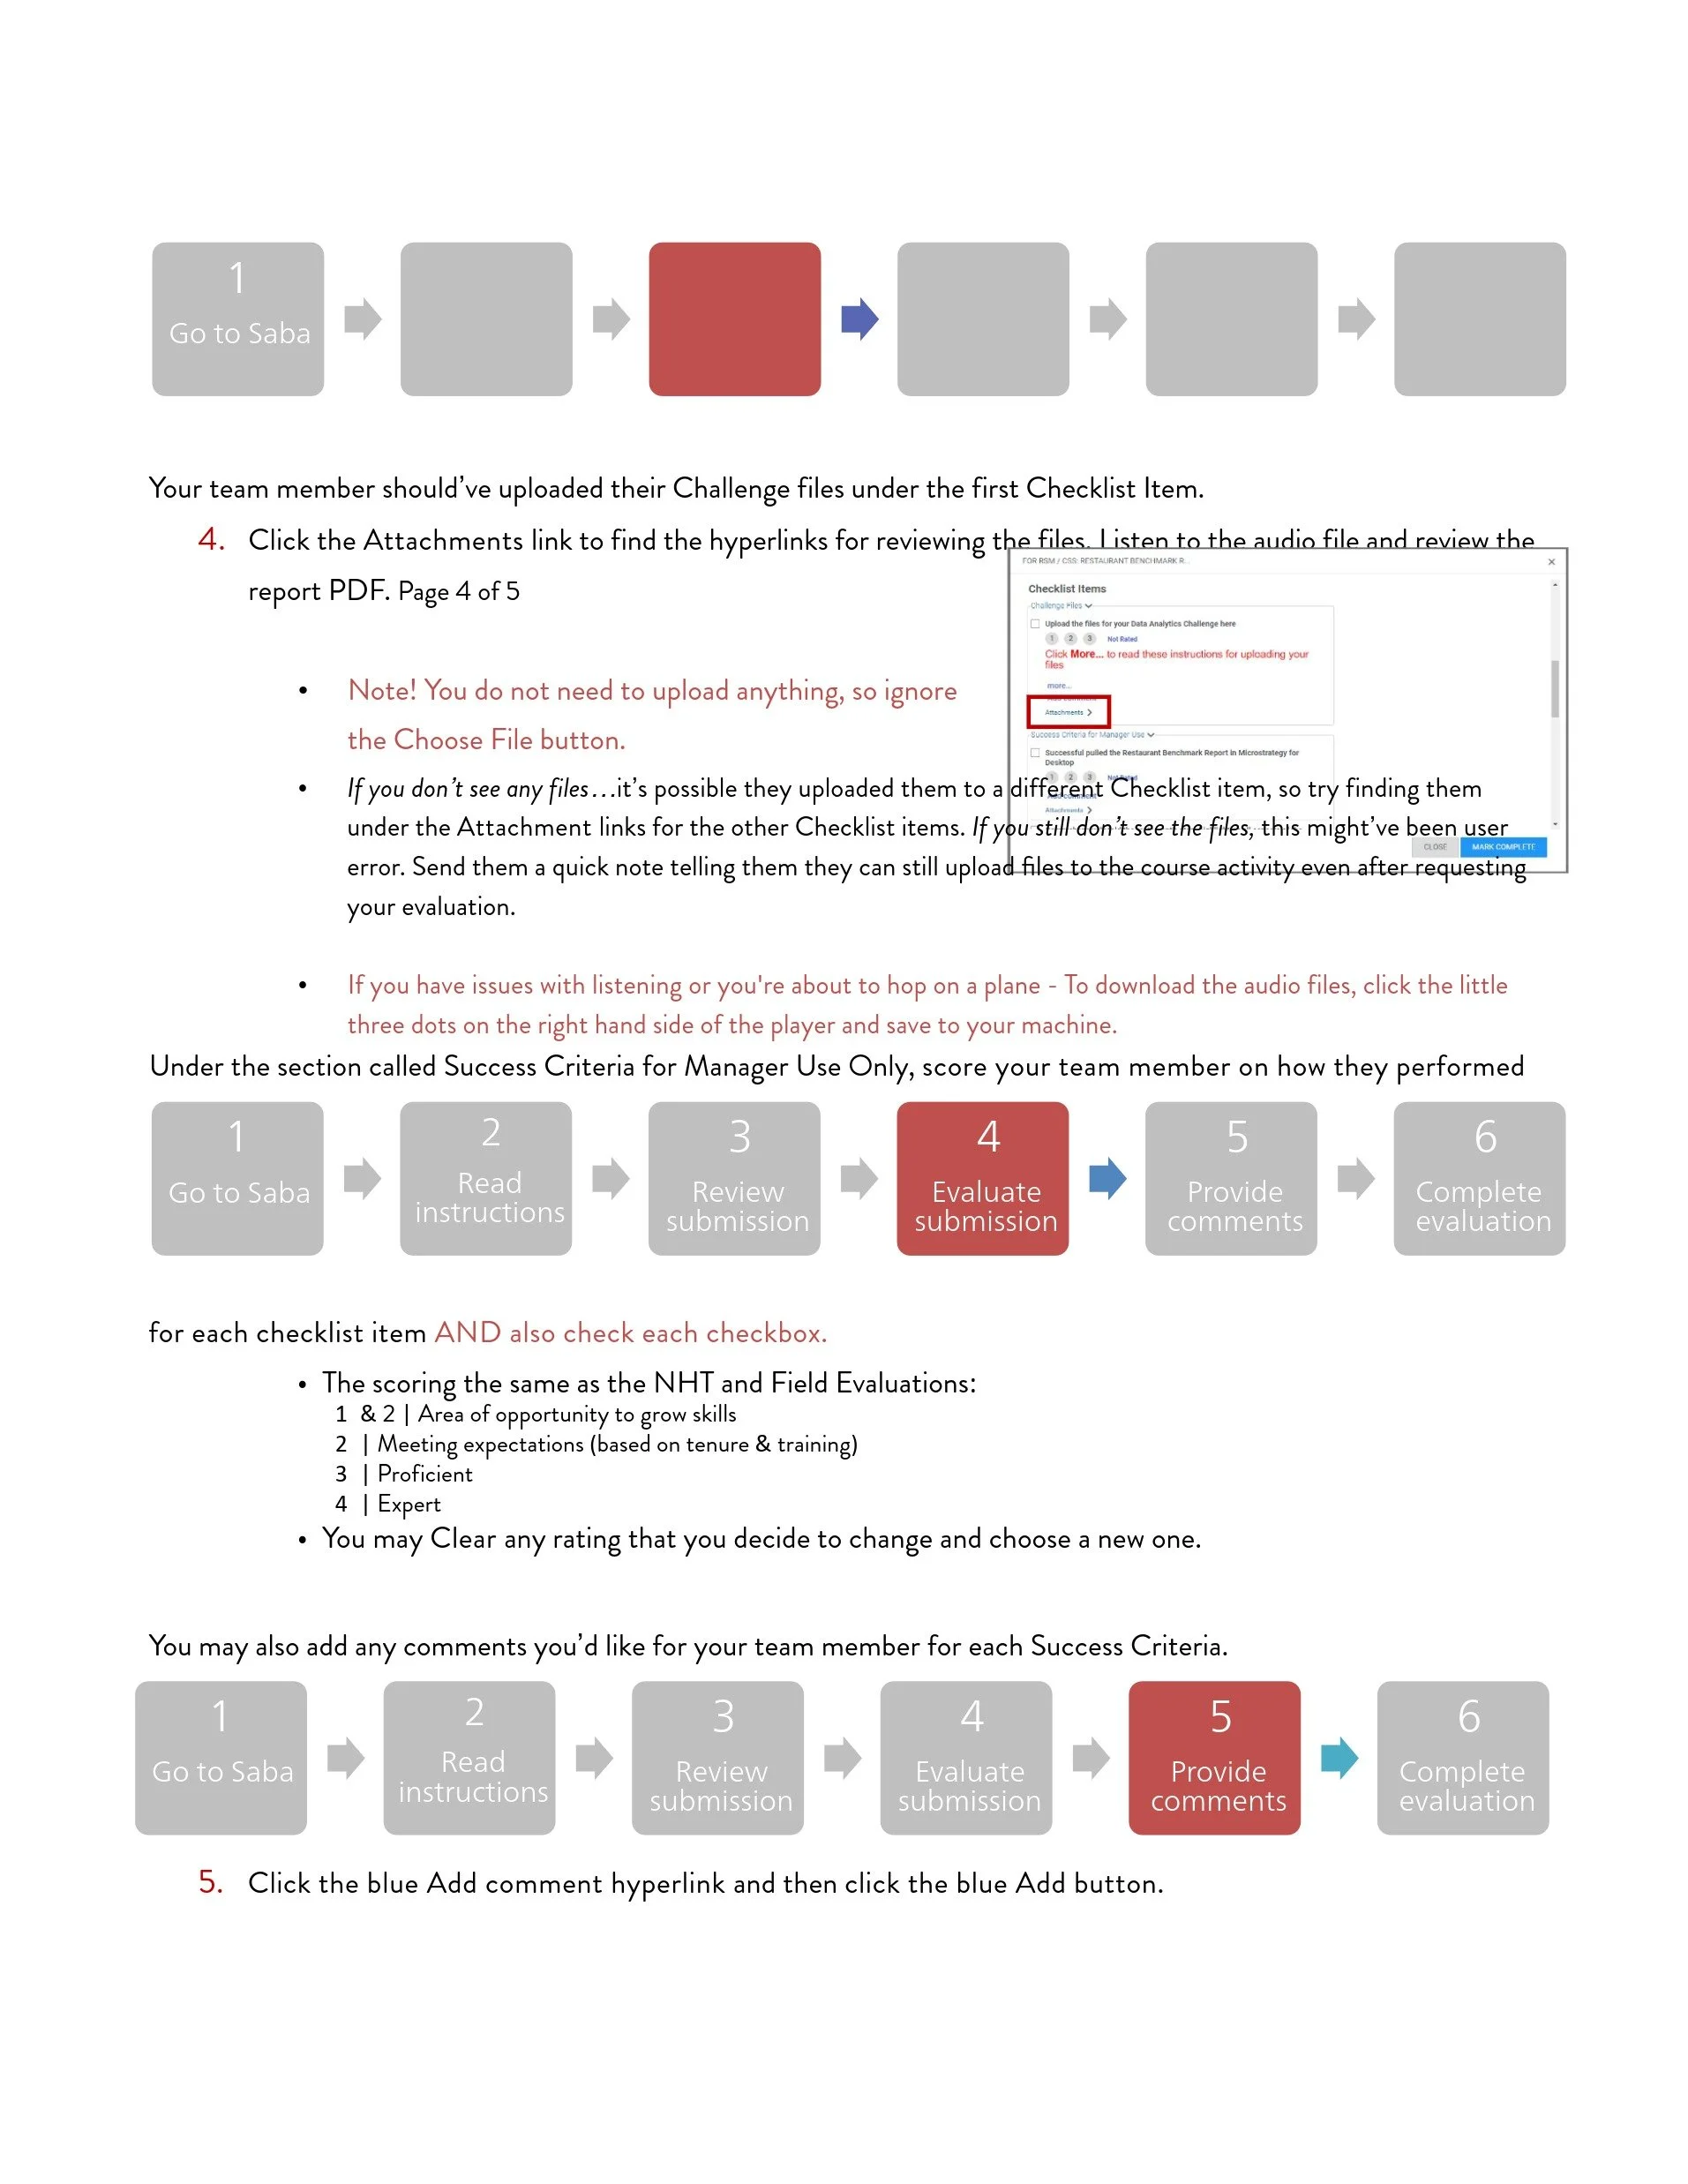
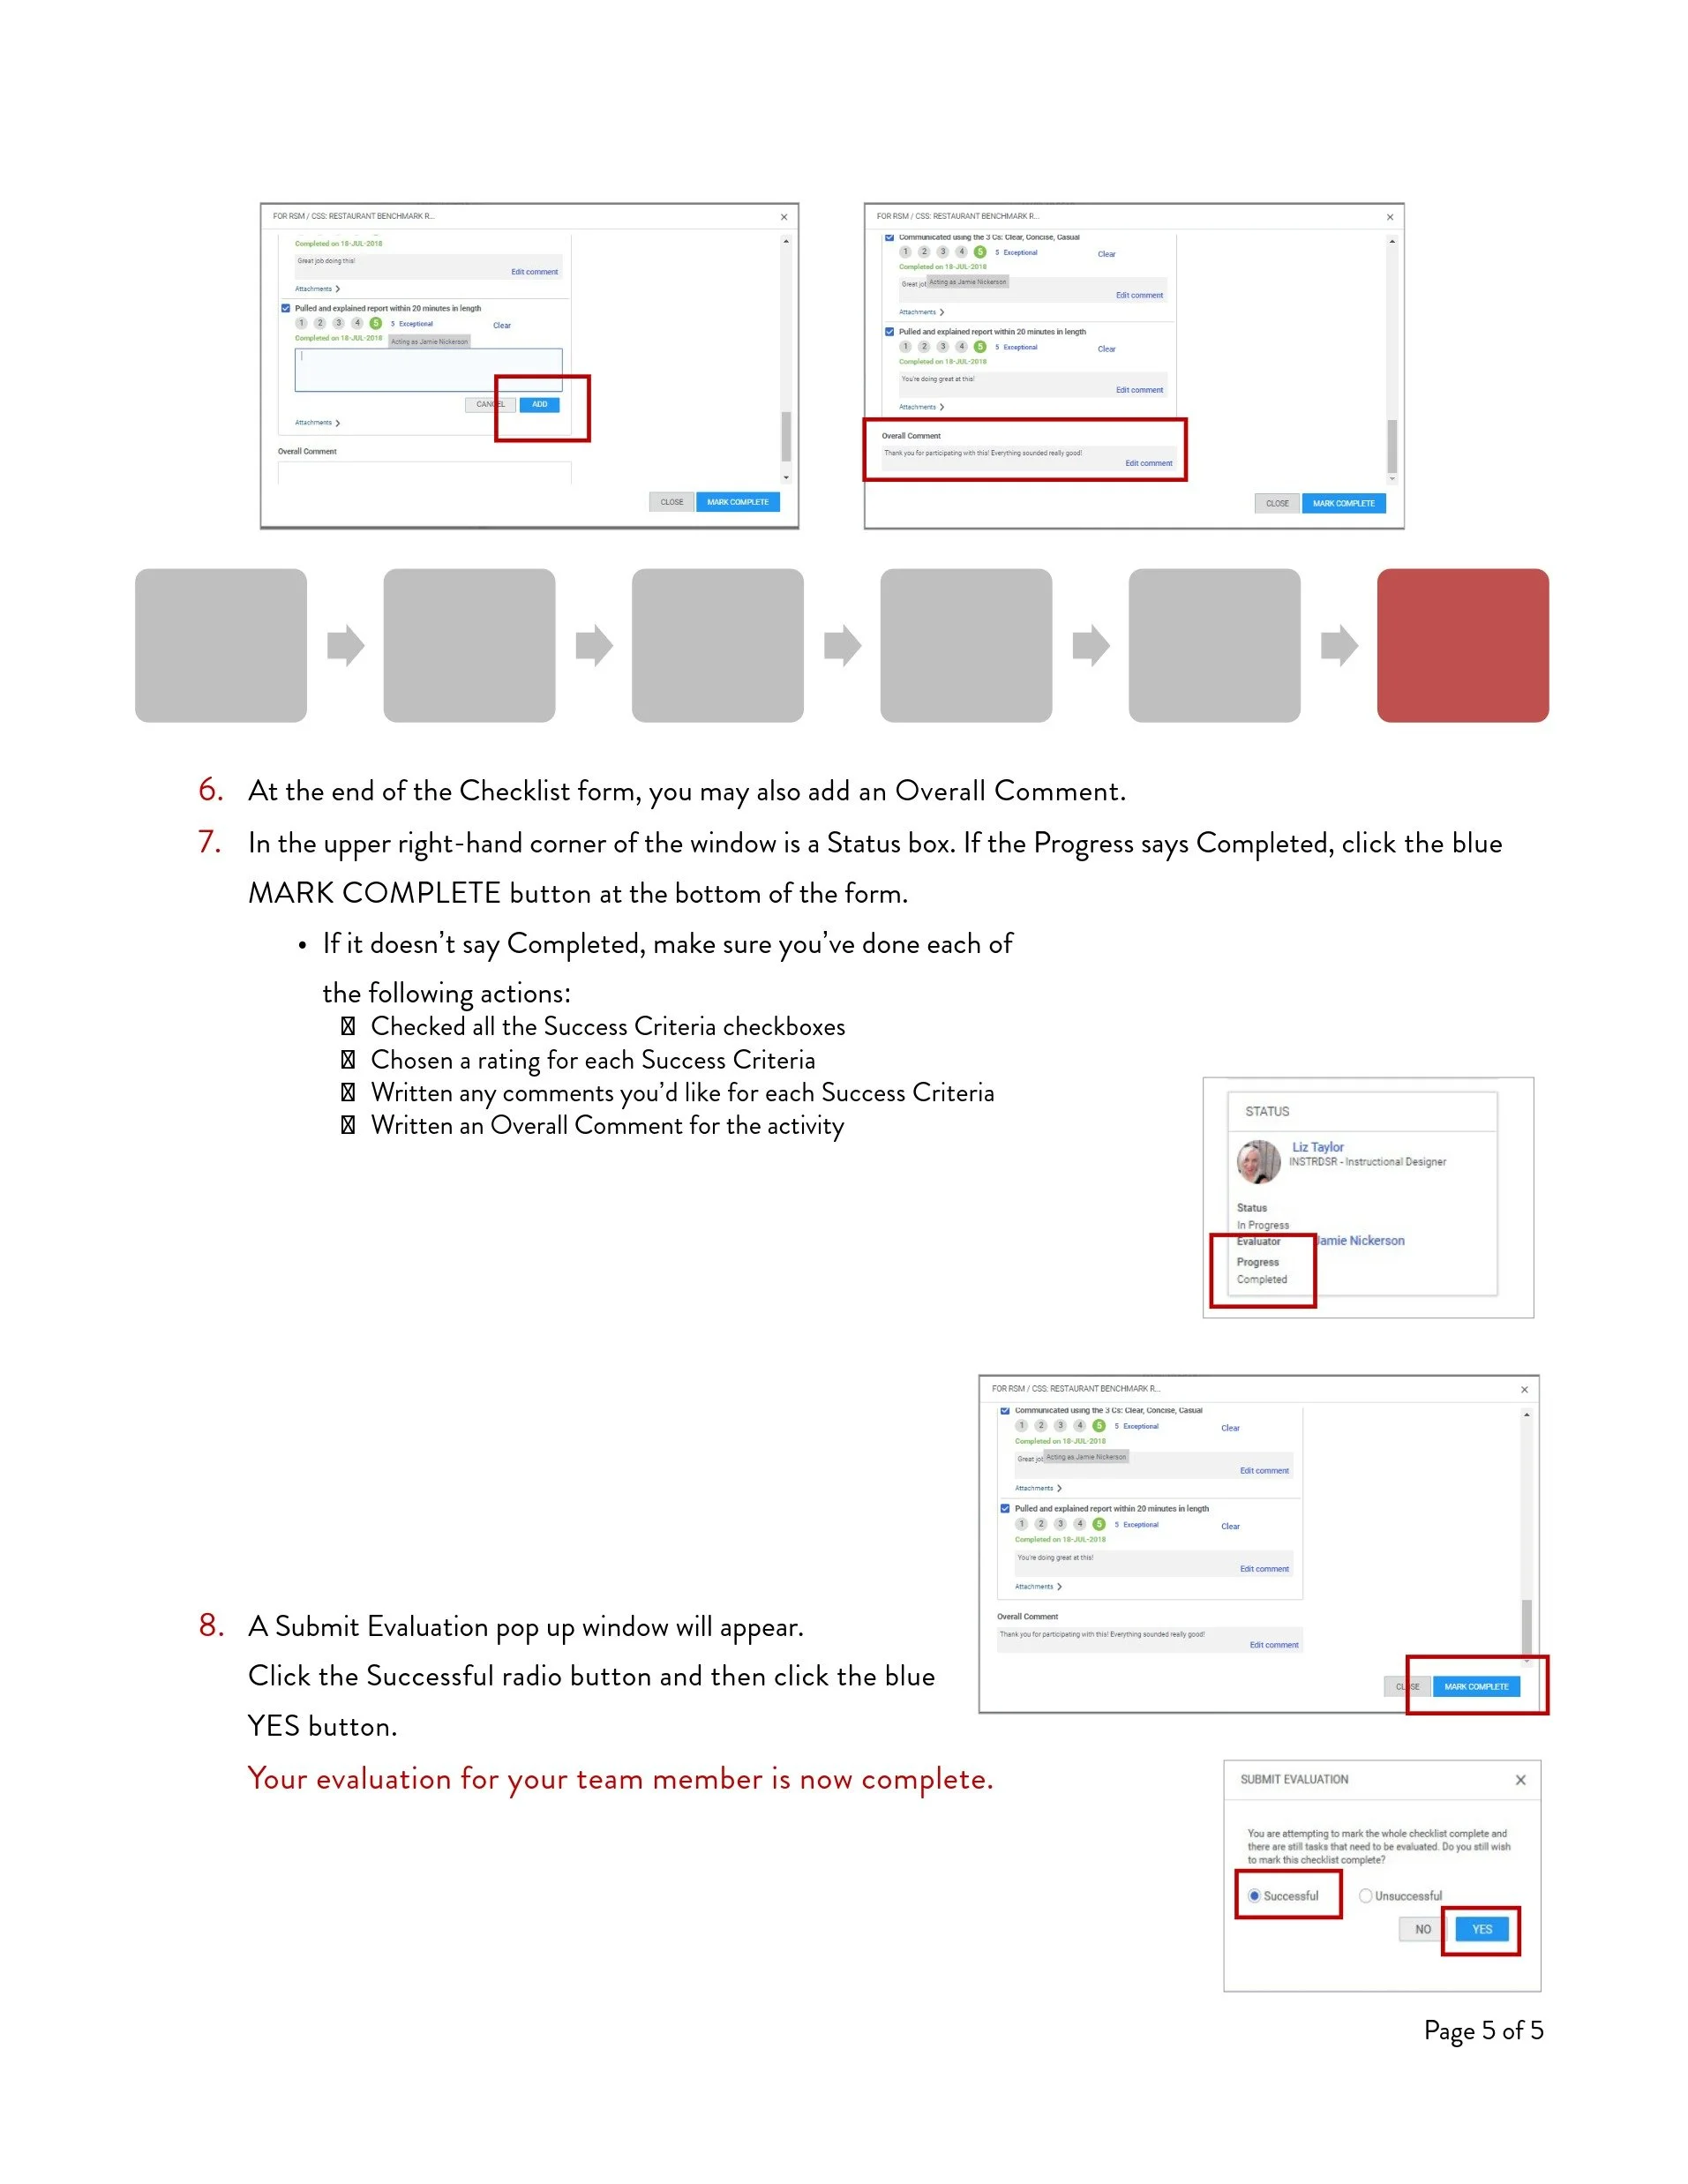
Coaching and evaluation: Sales managers used structured success criteria to review submissions and provide immediate, actionable feedback.
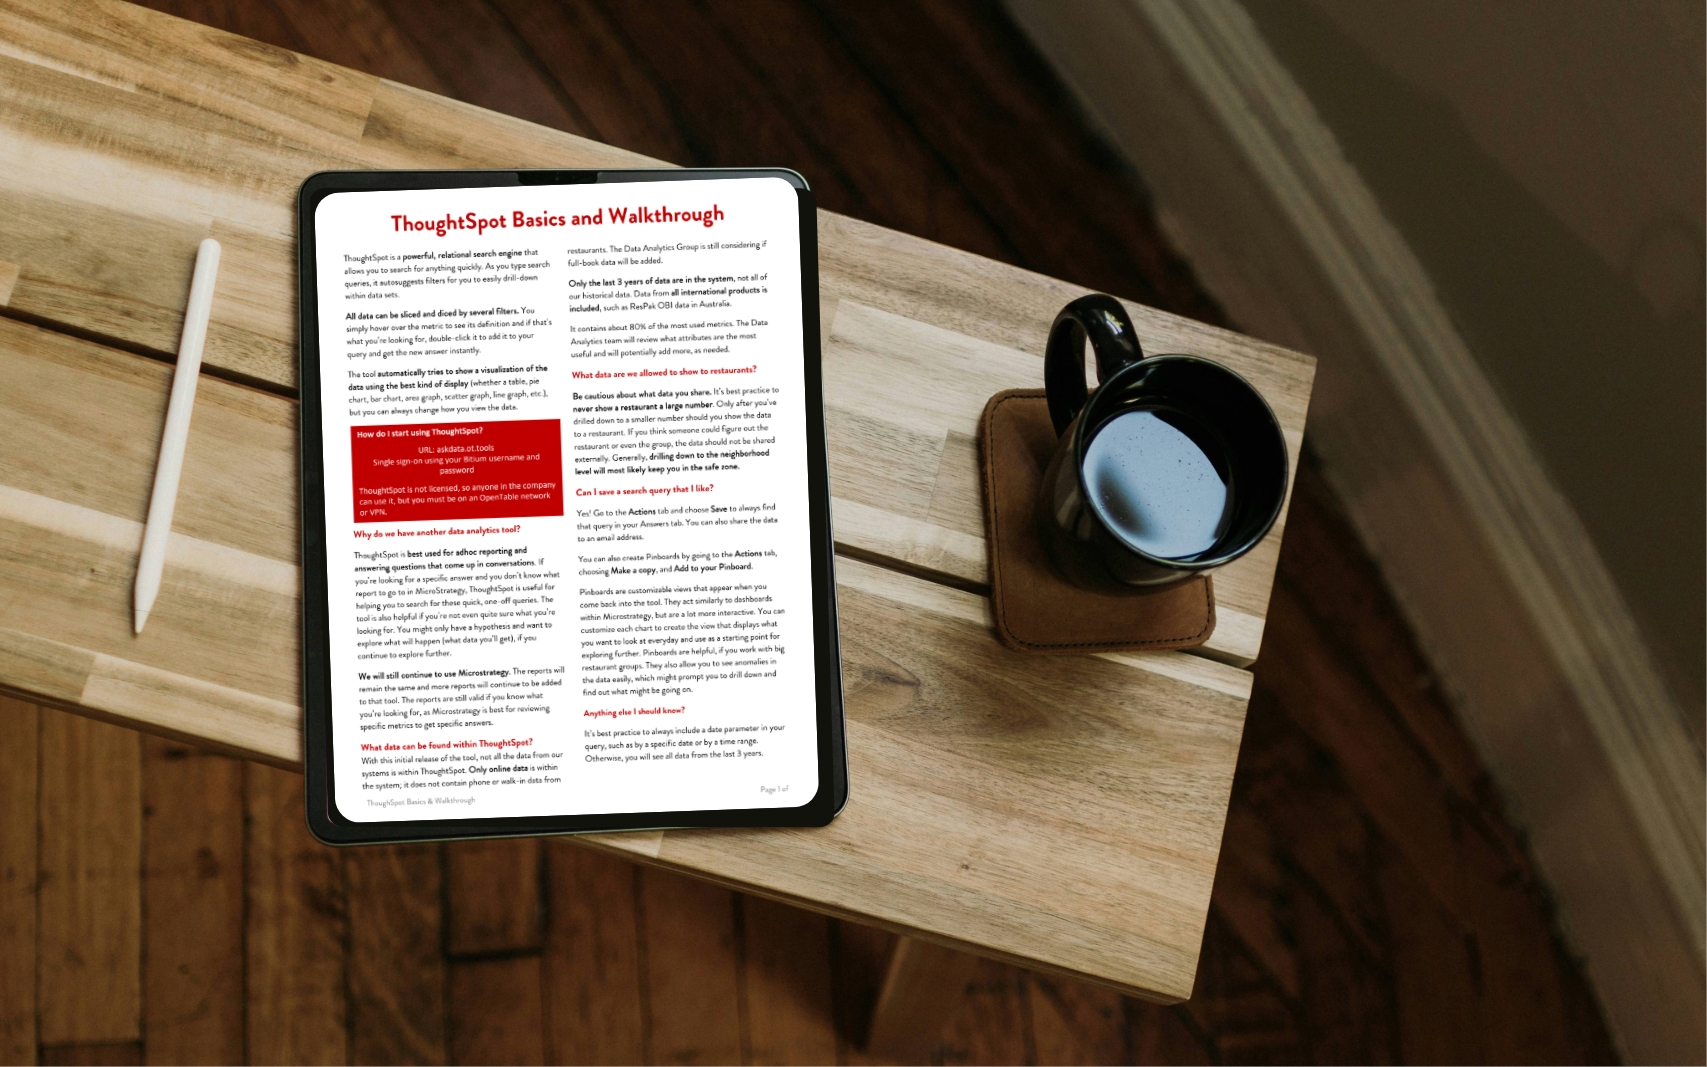
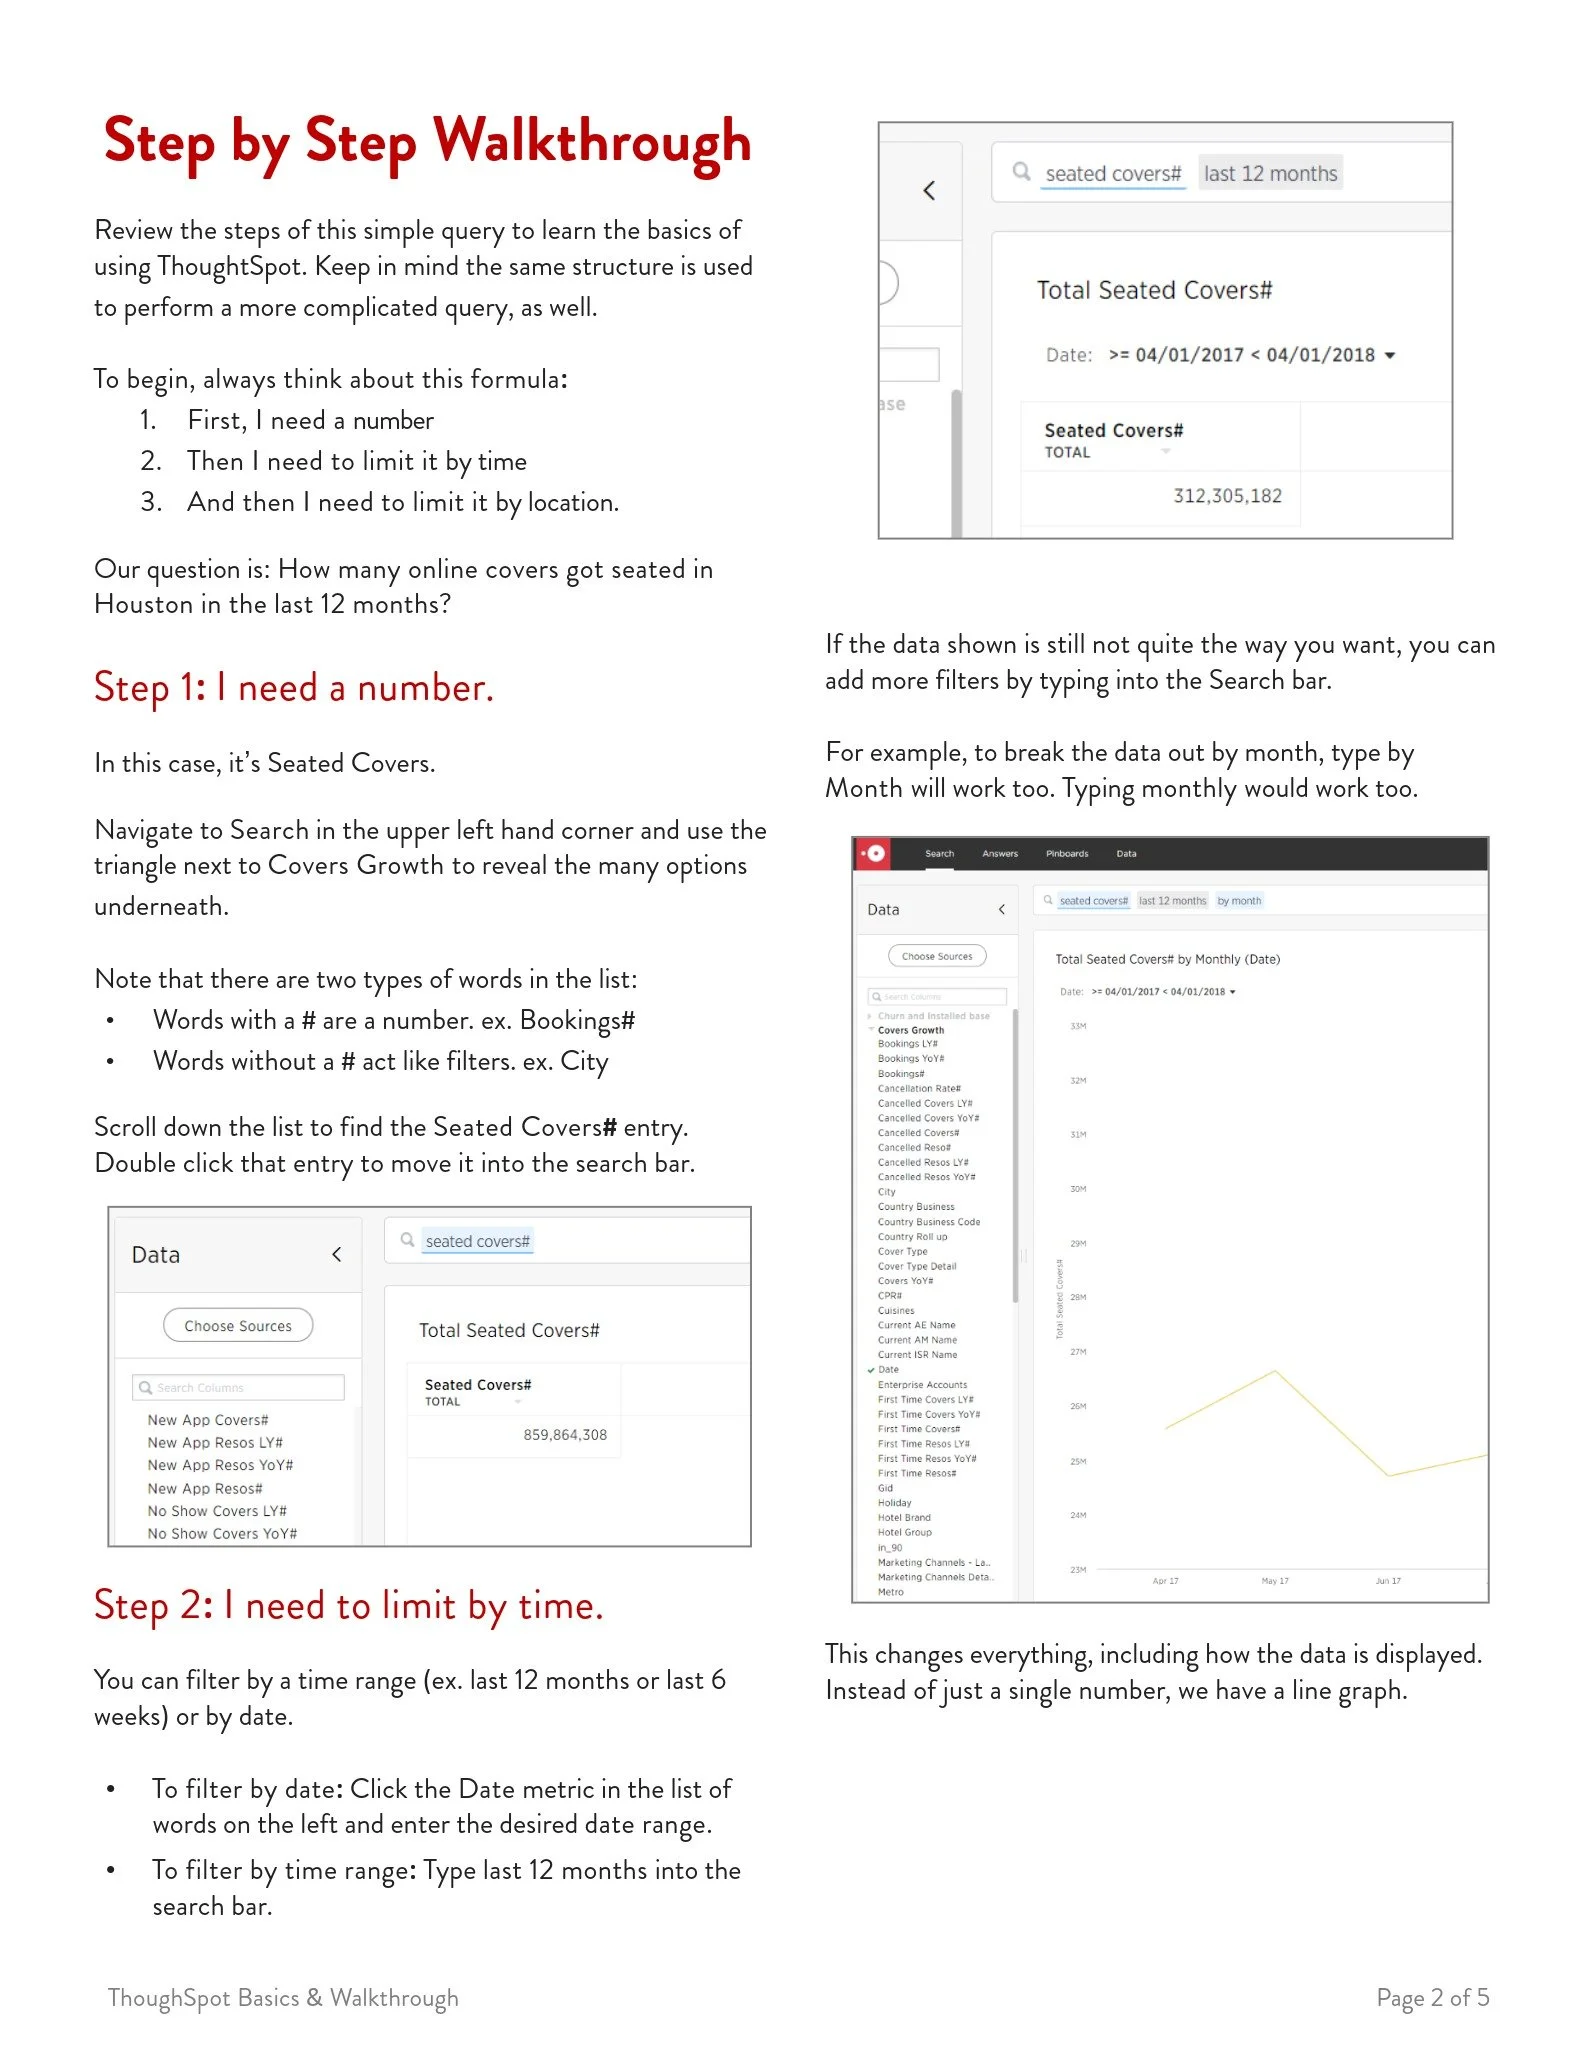
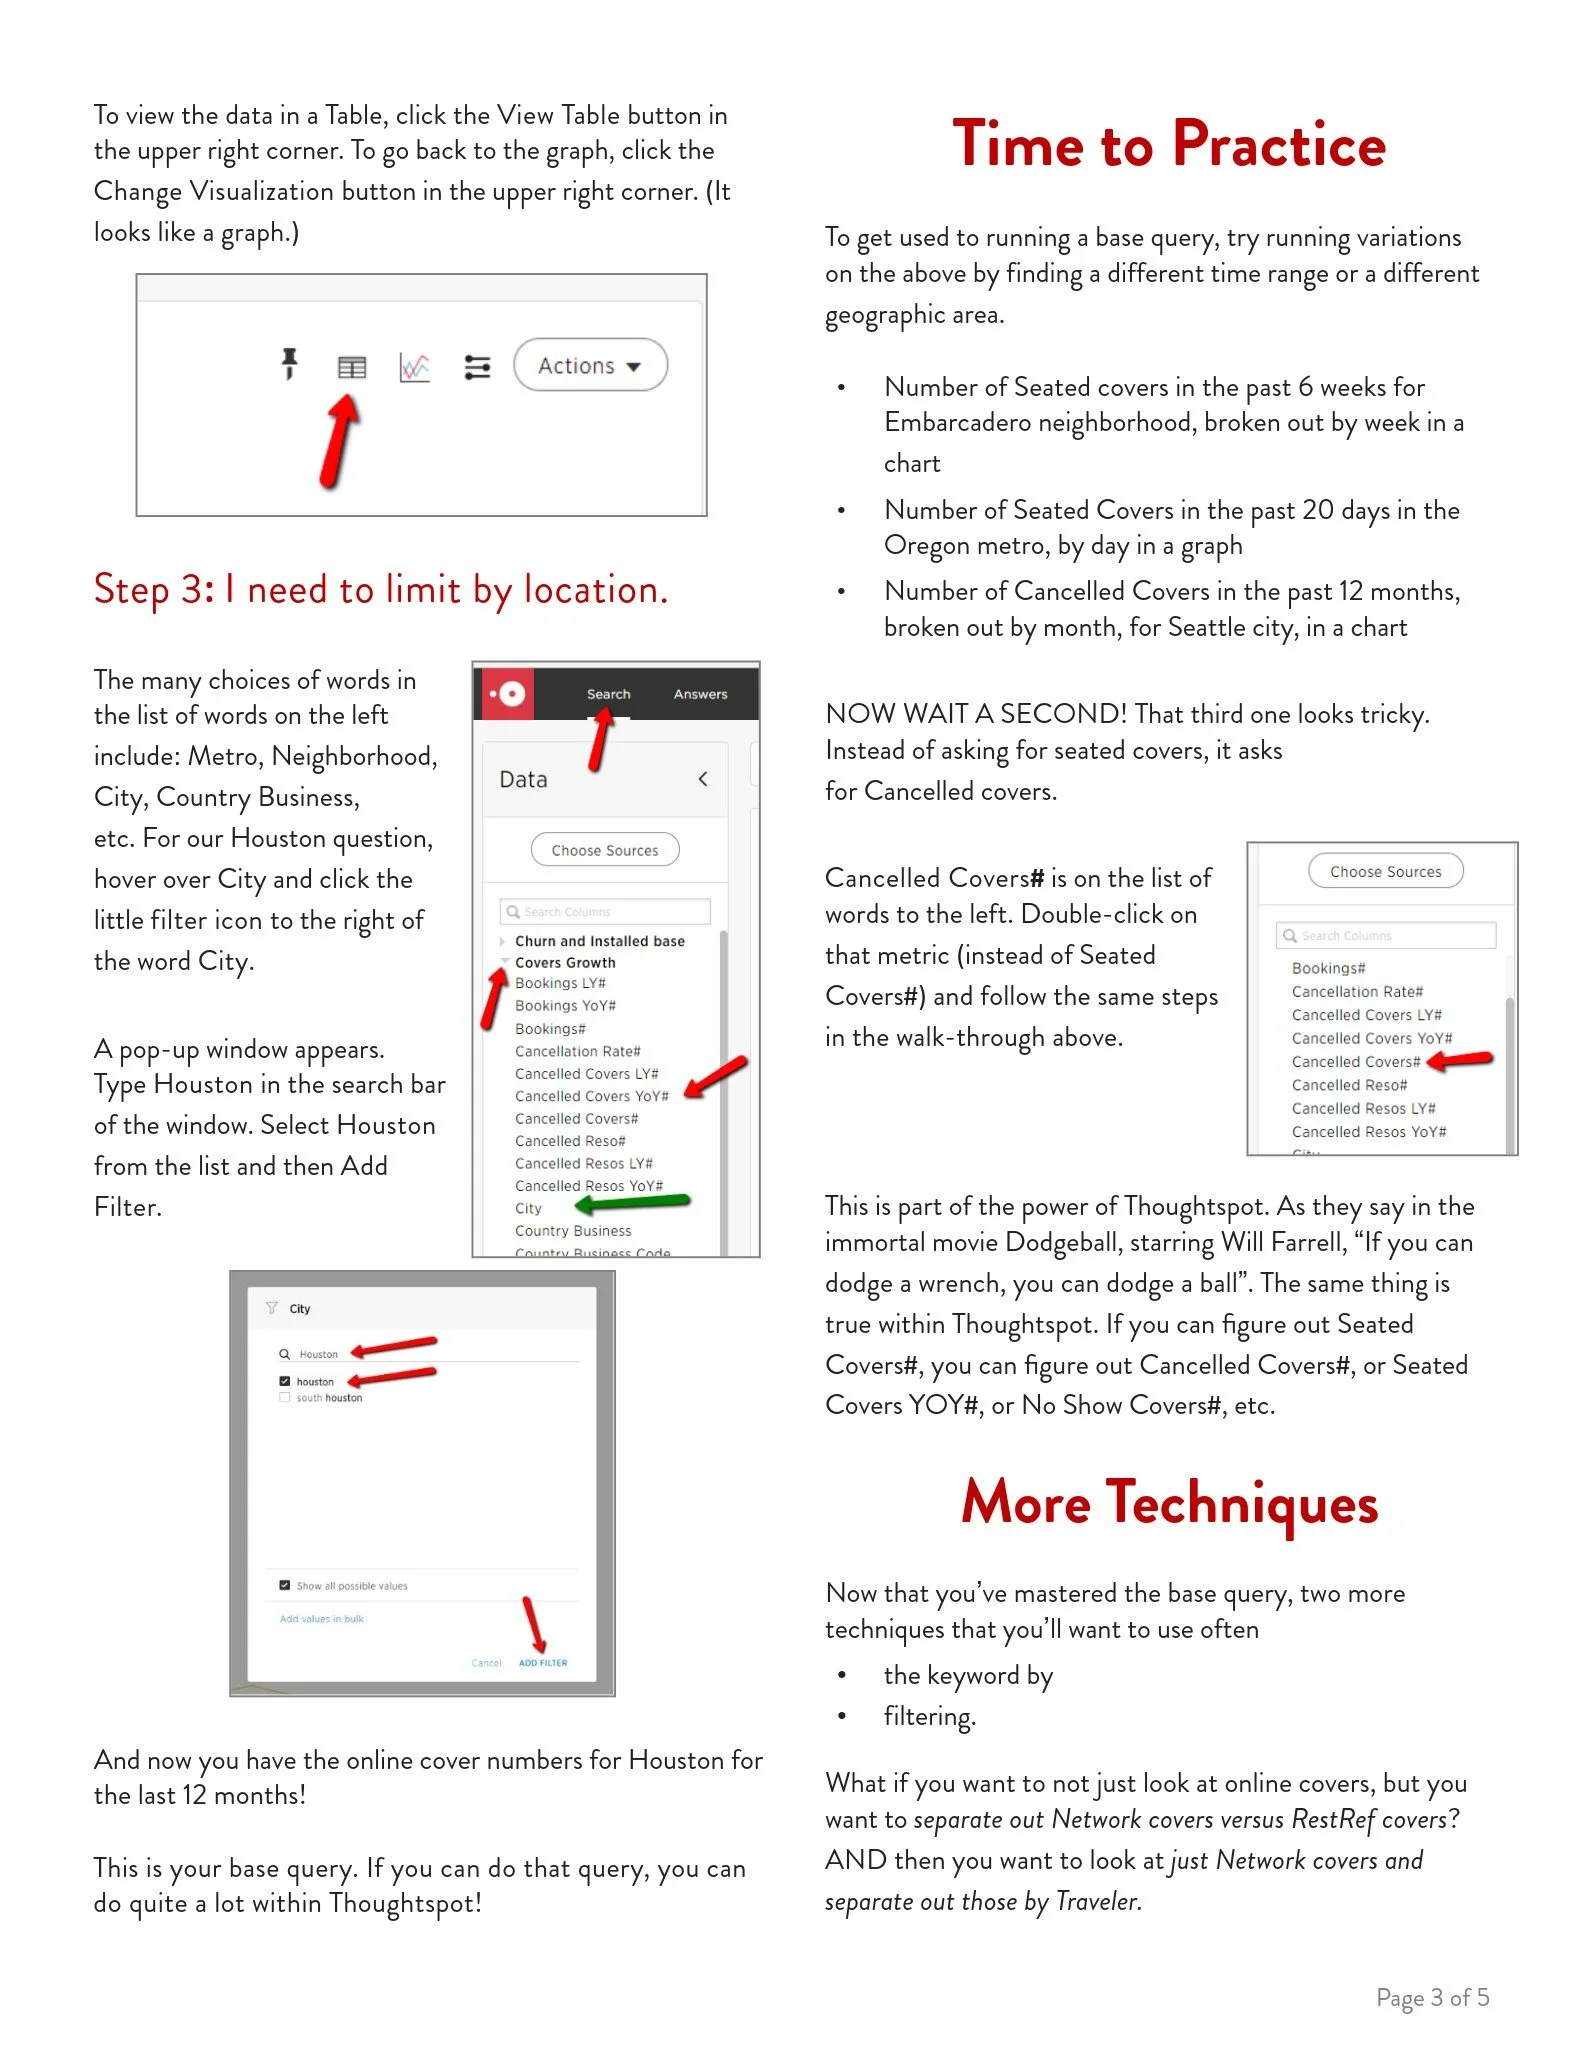
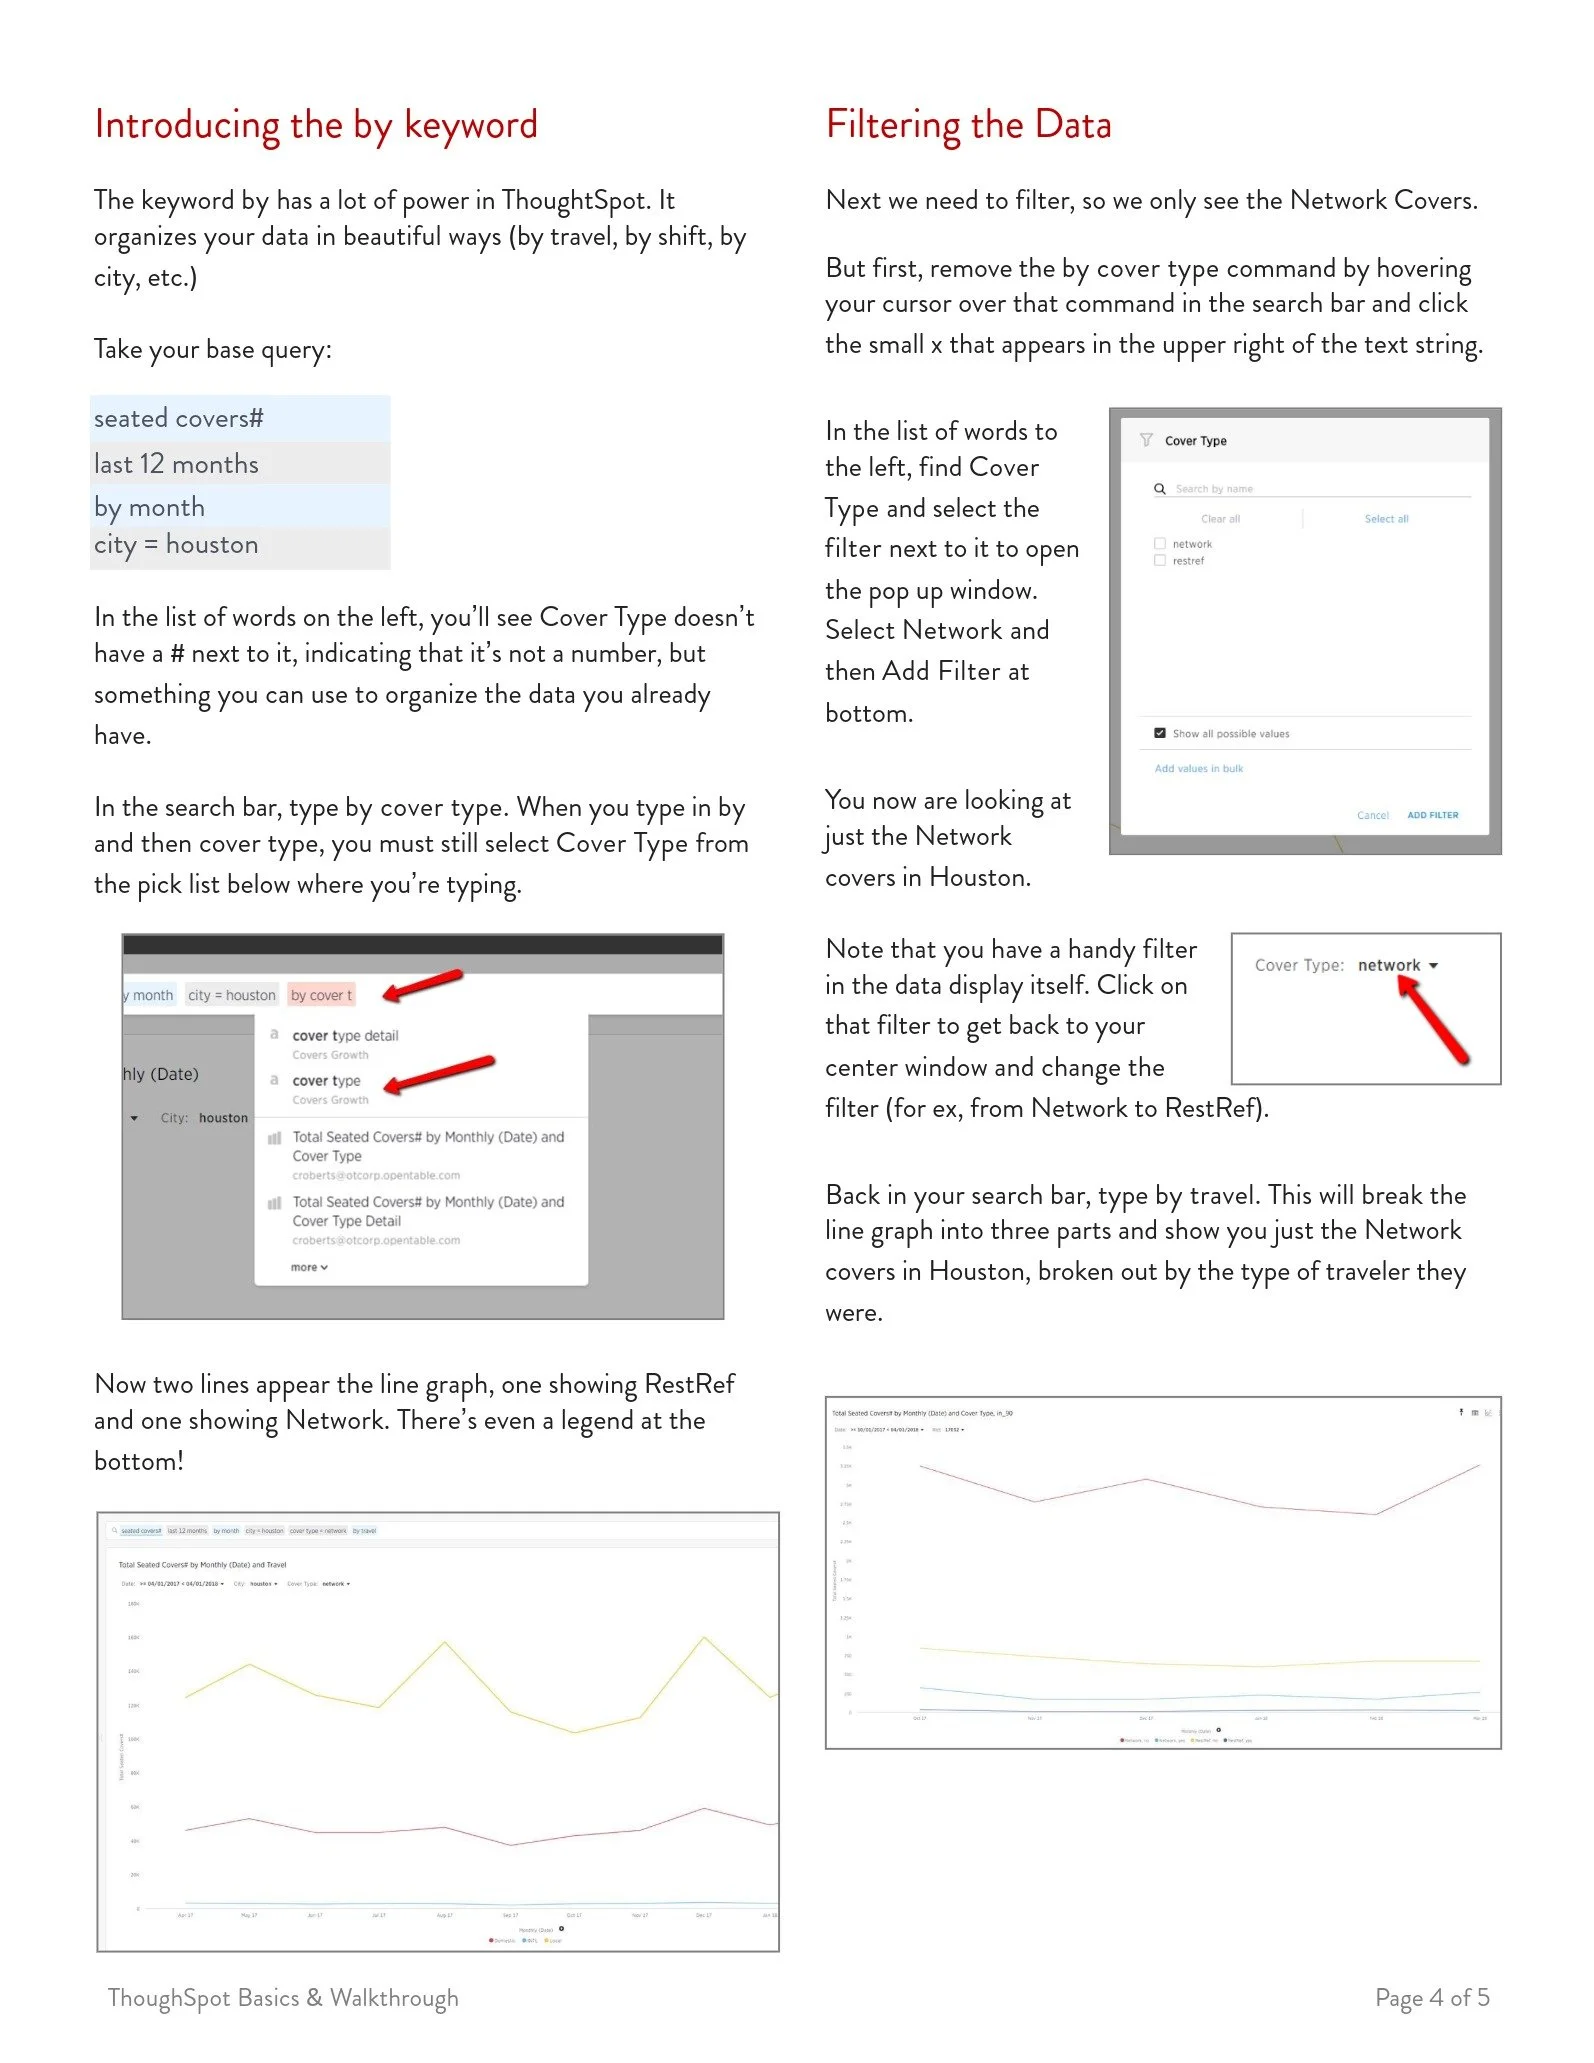
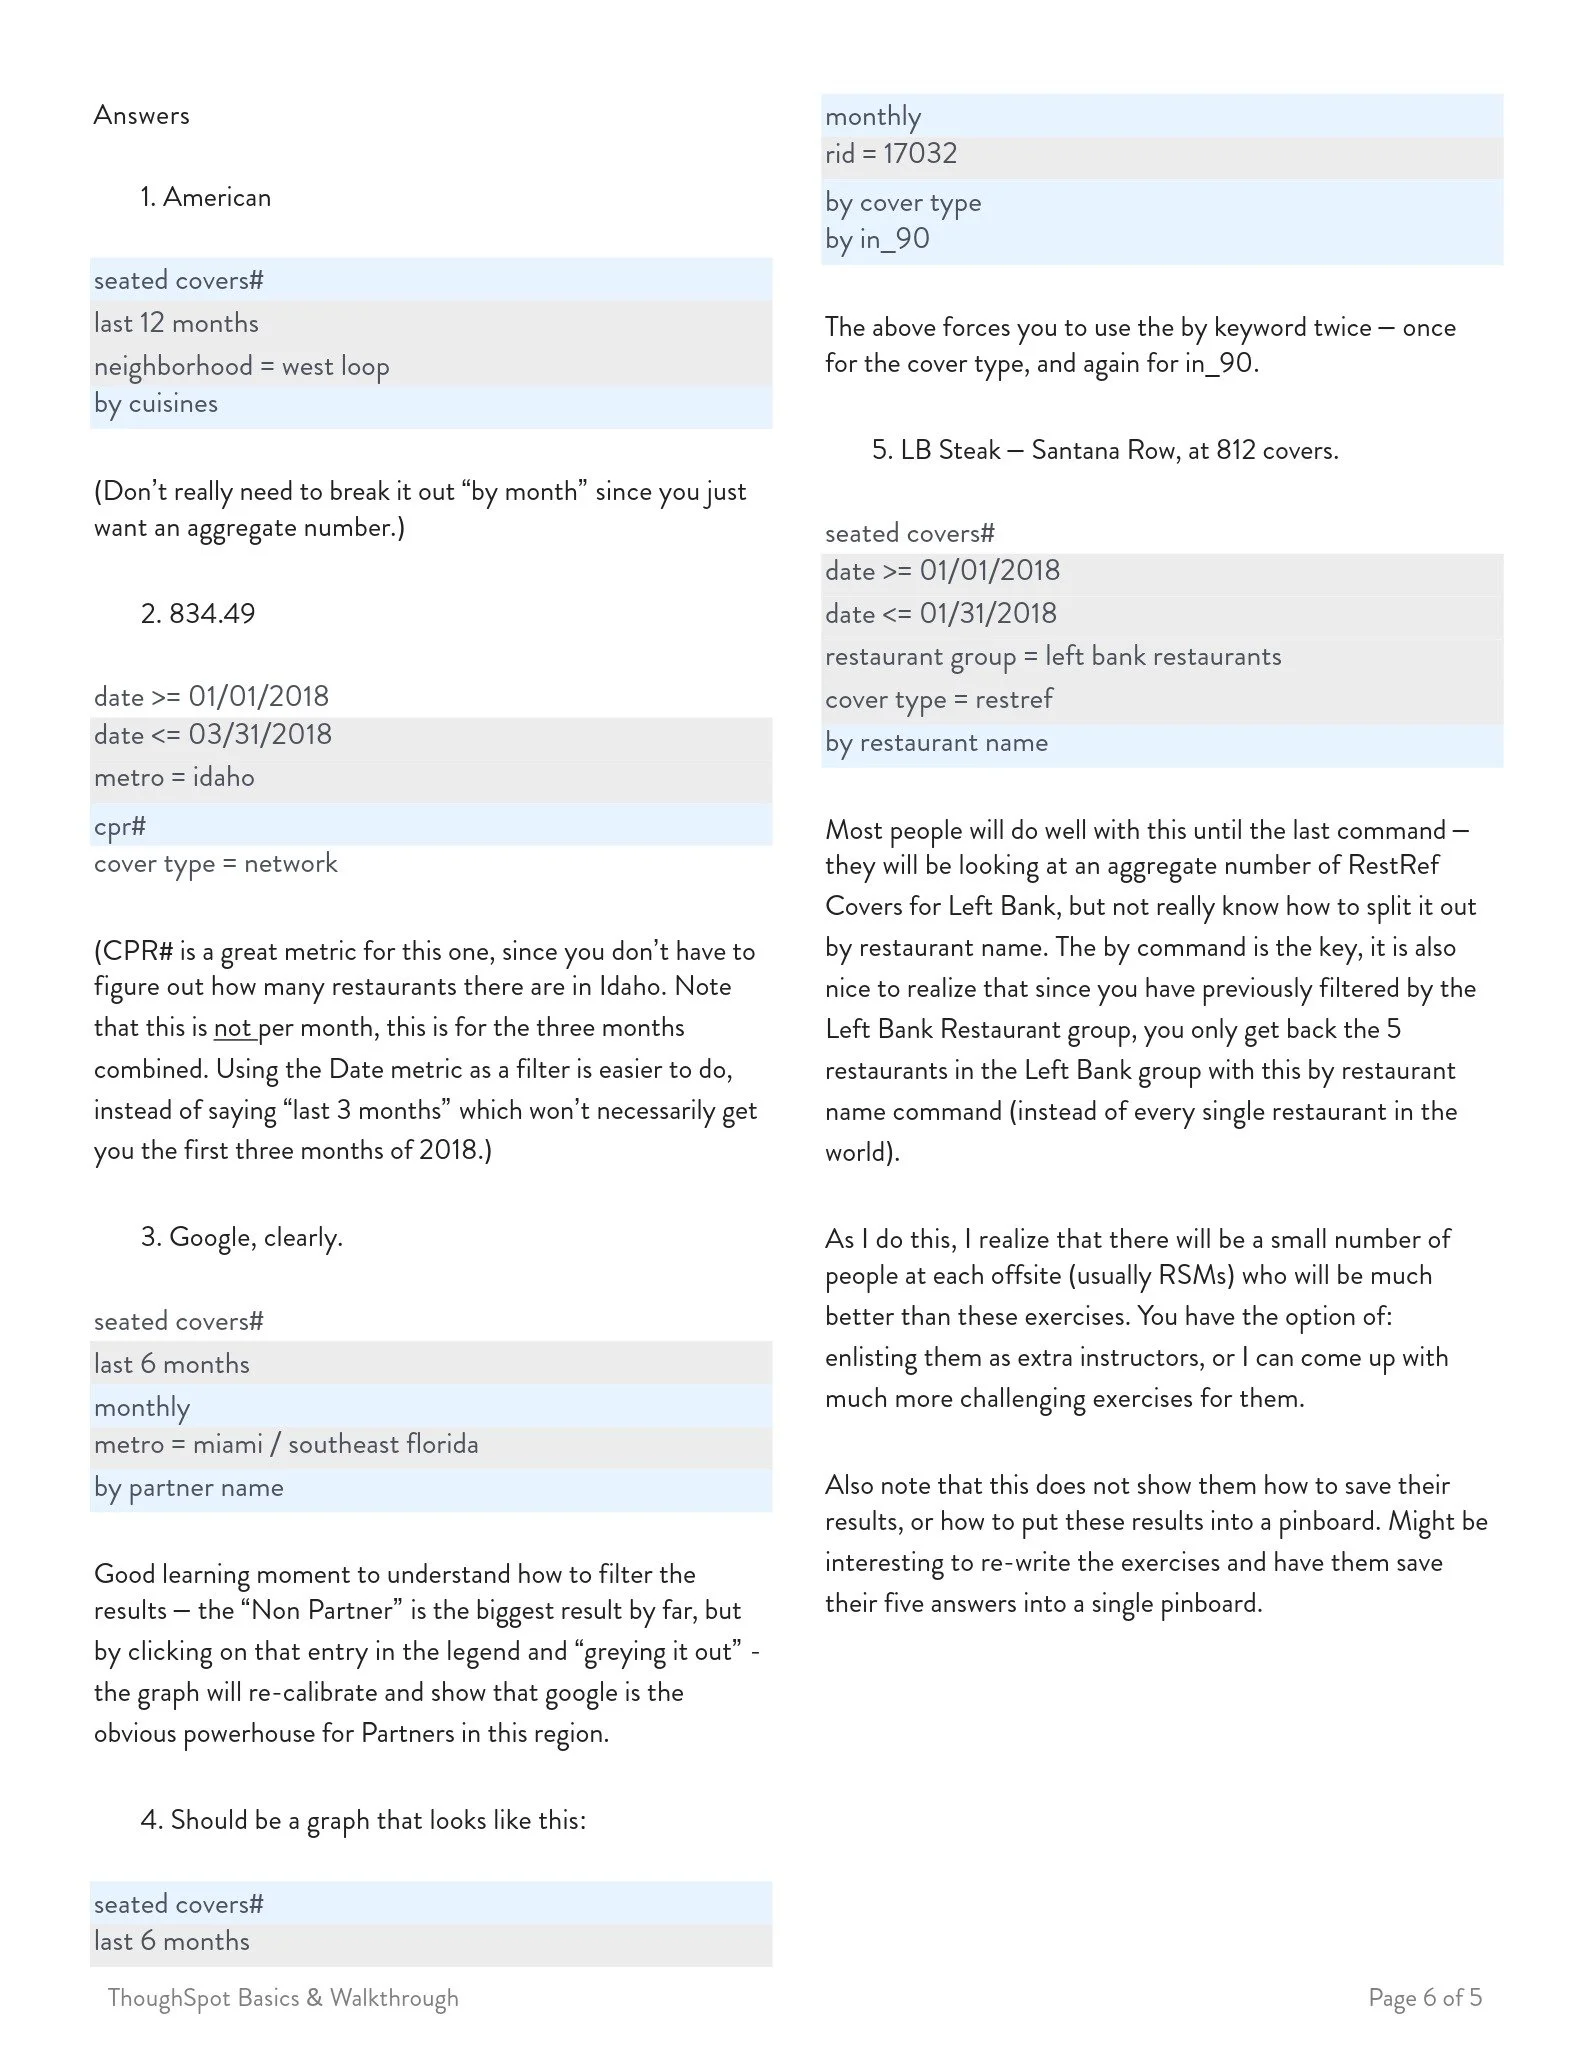
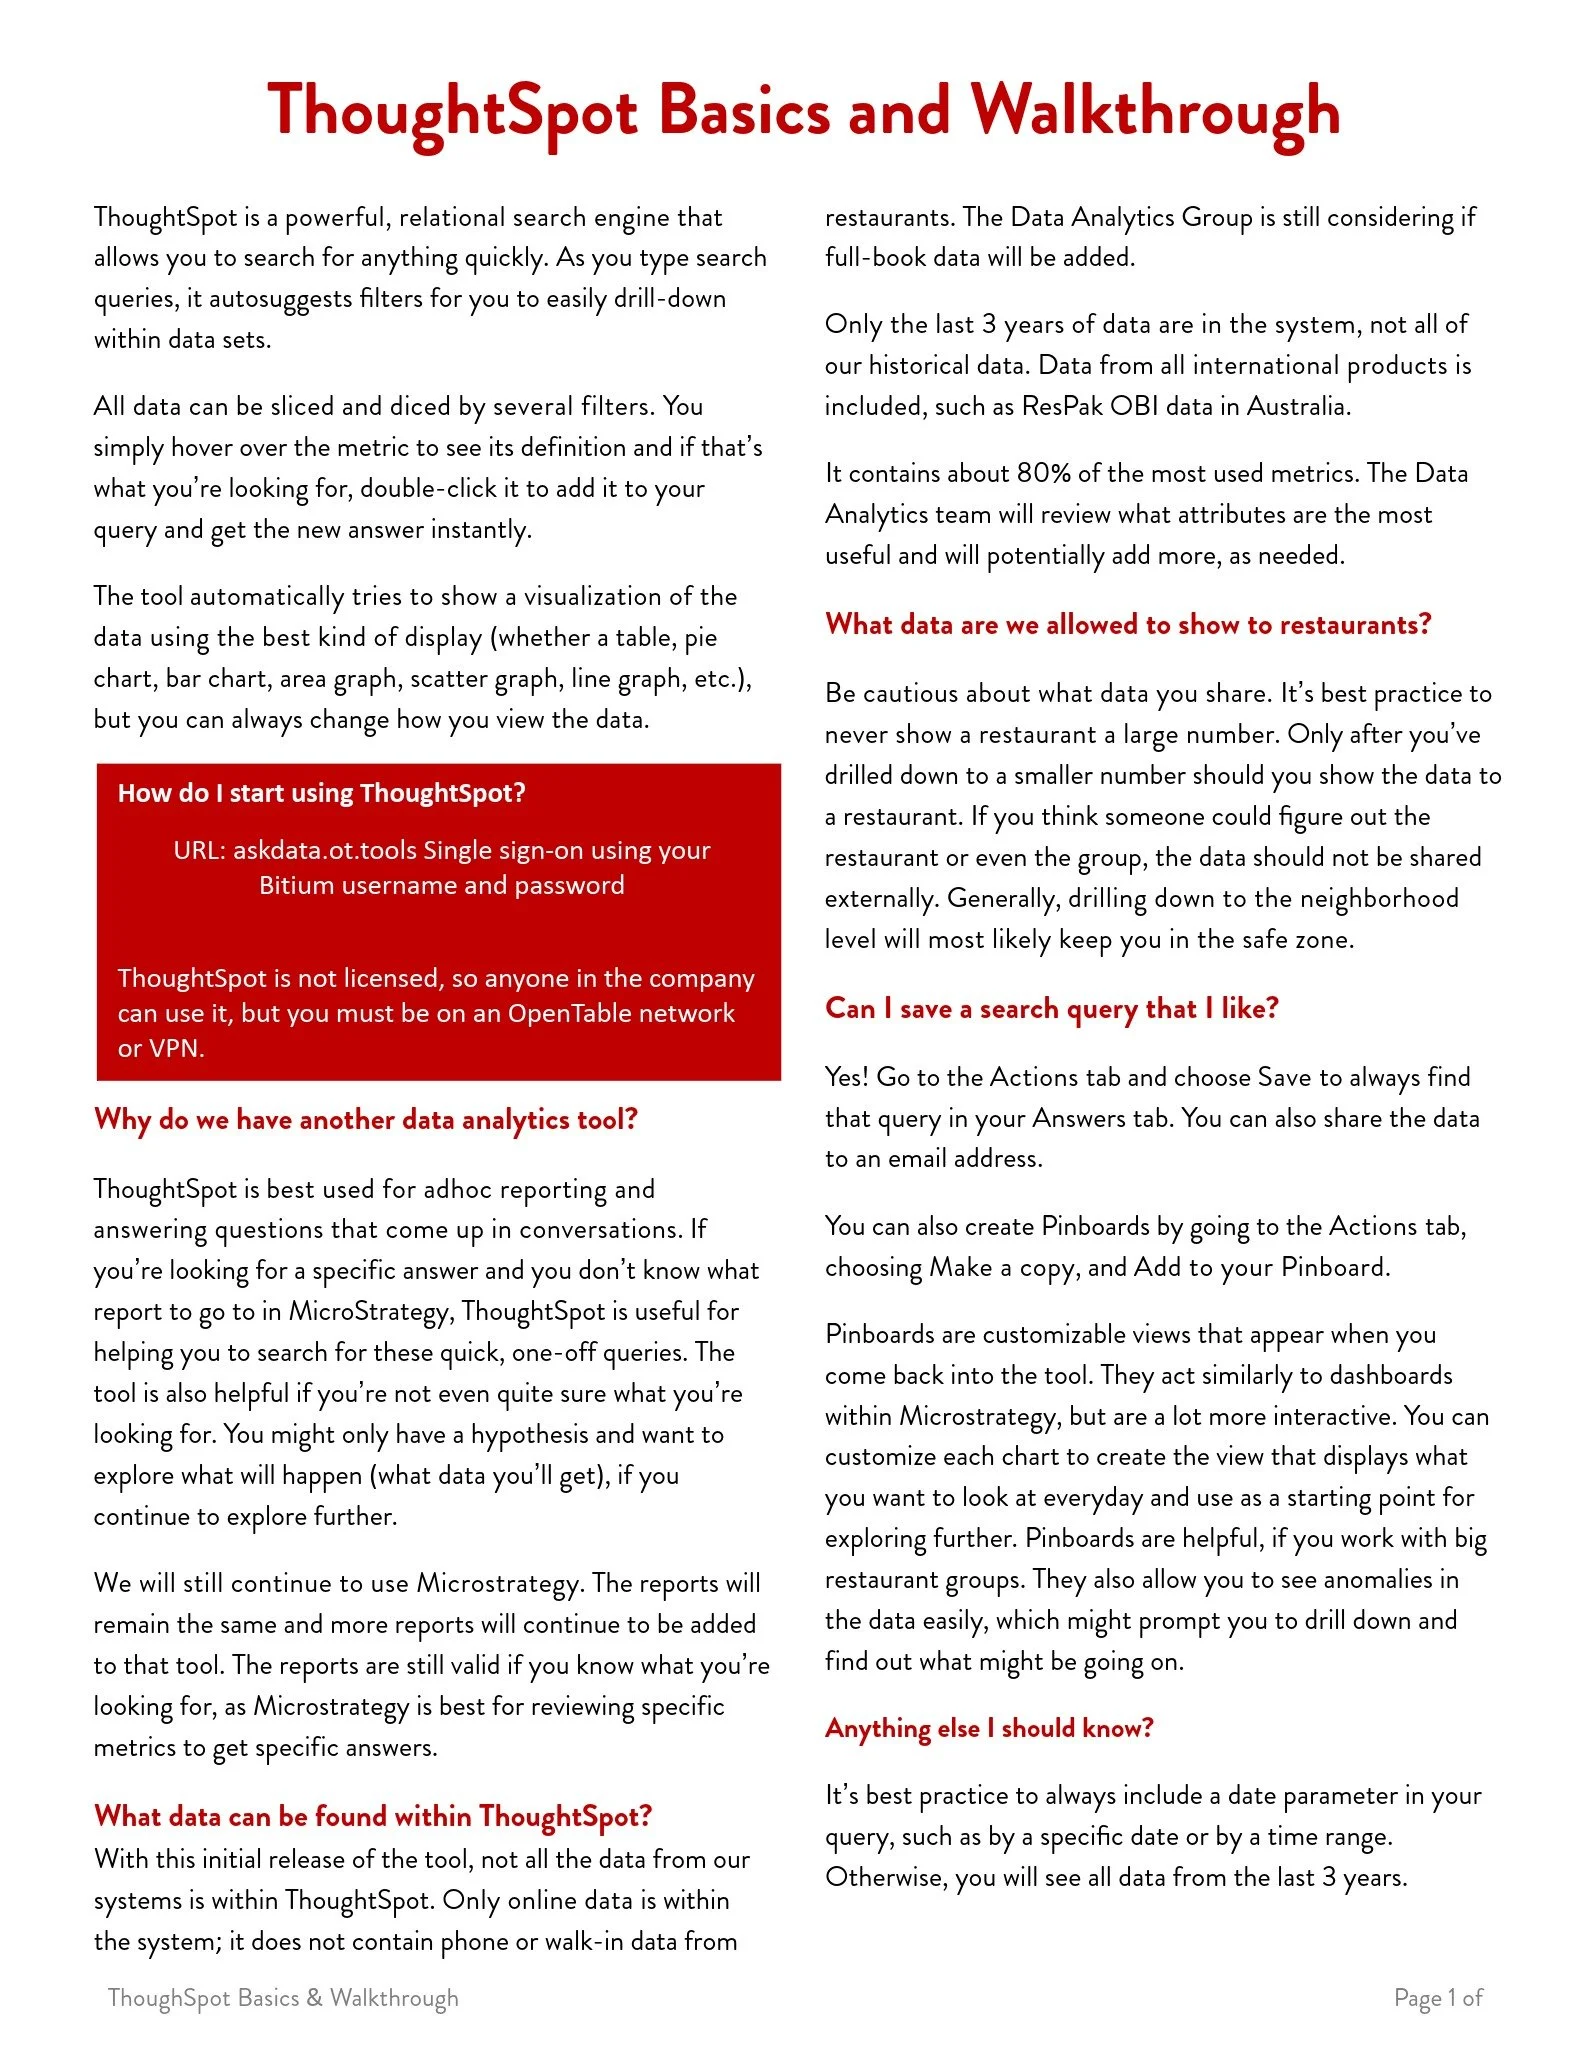
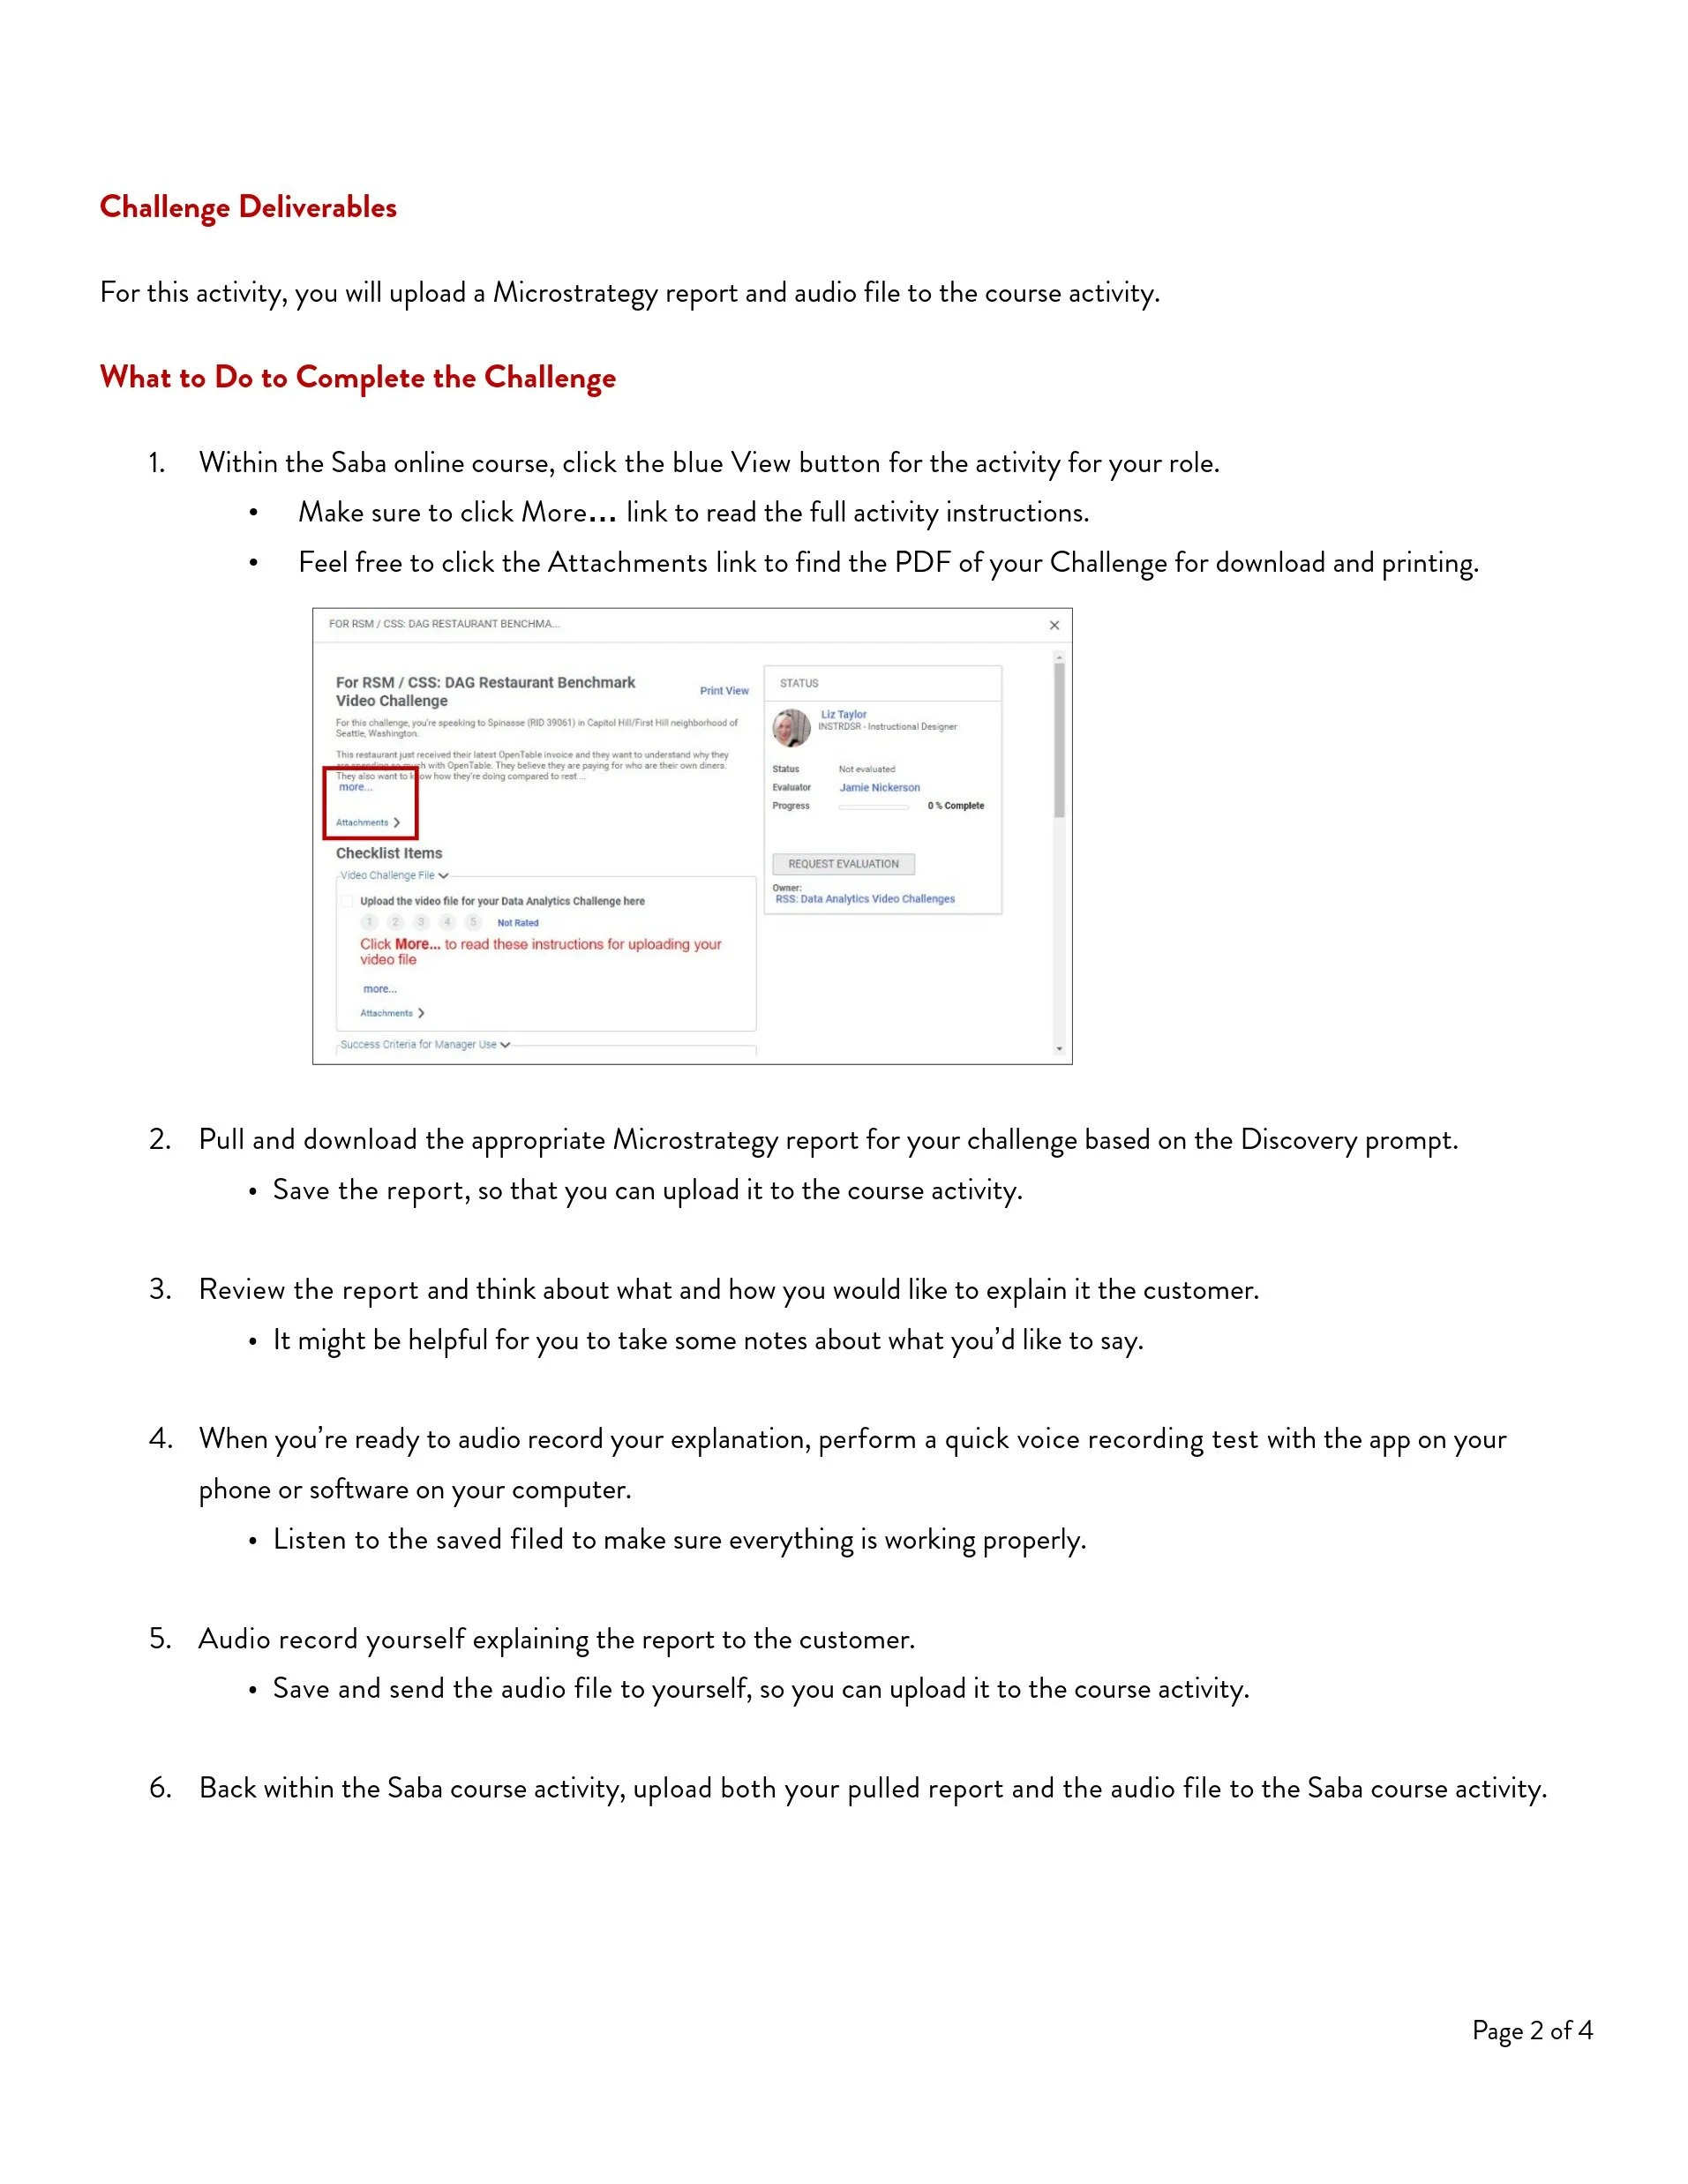
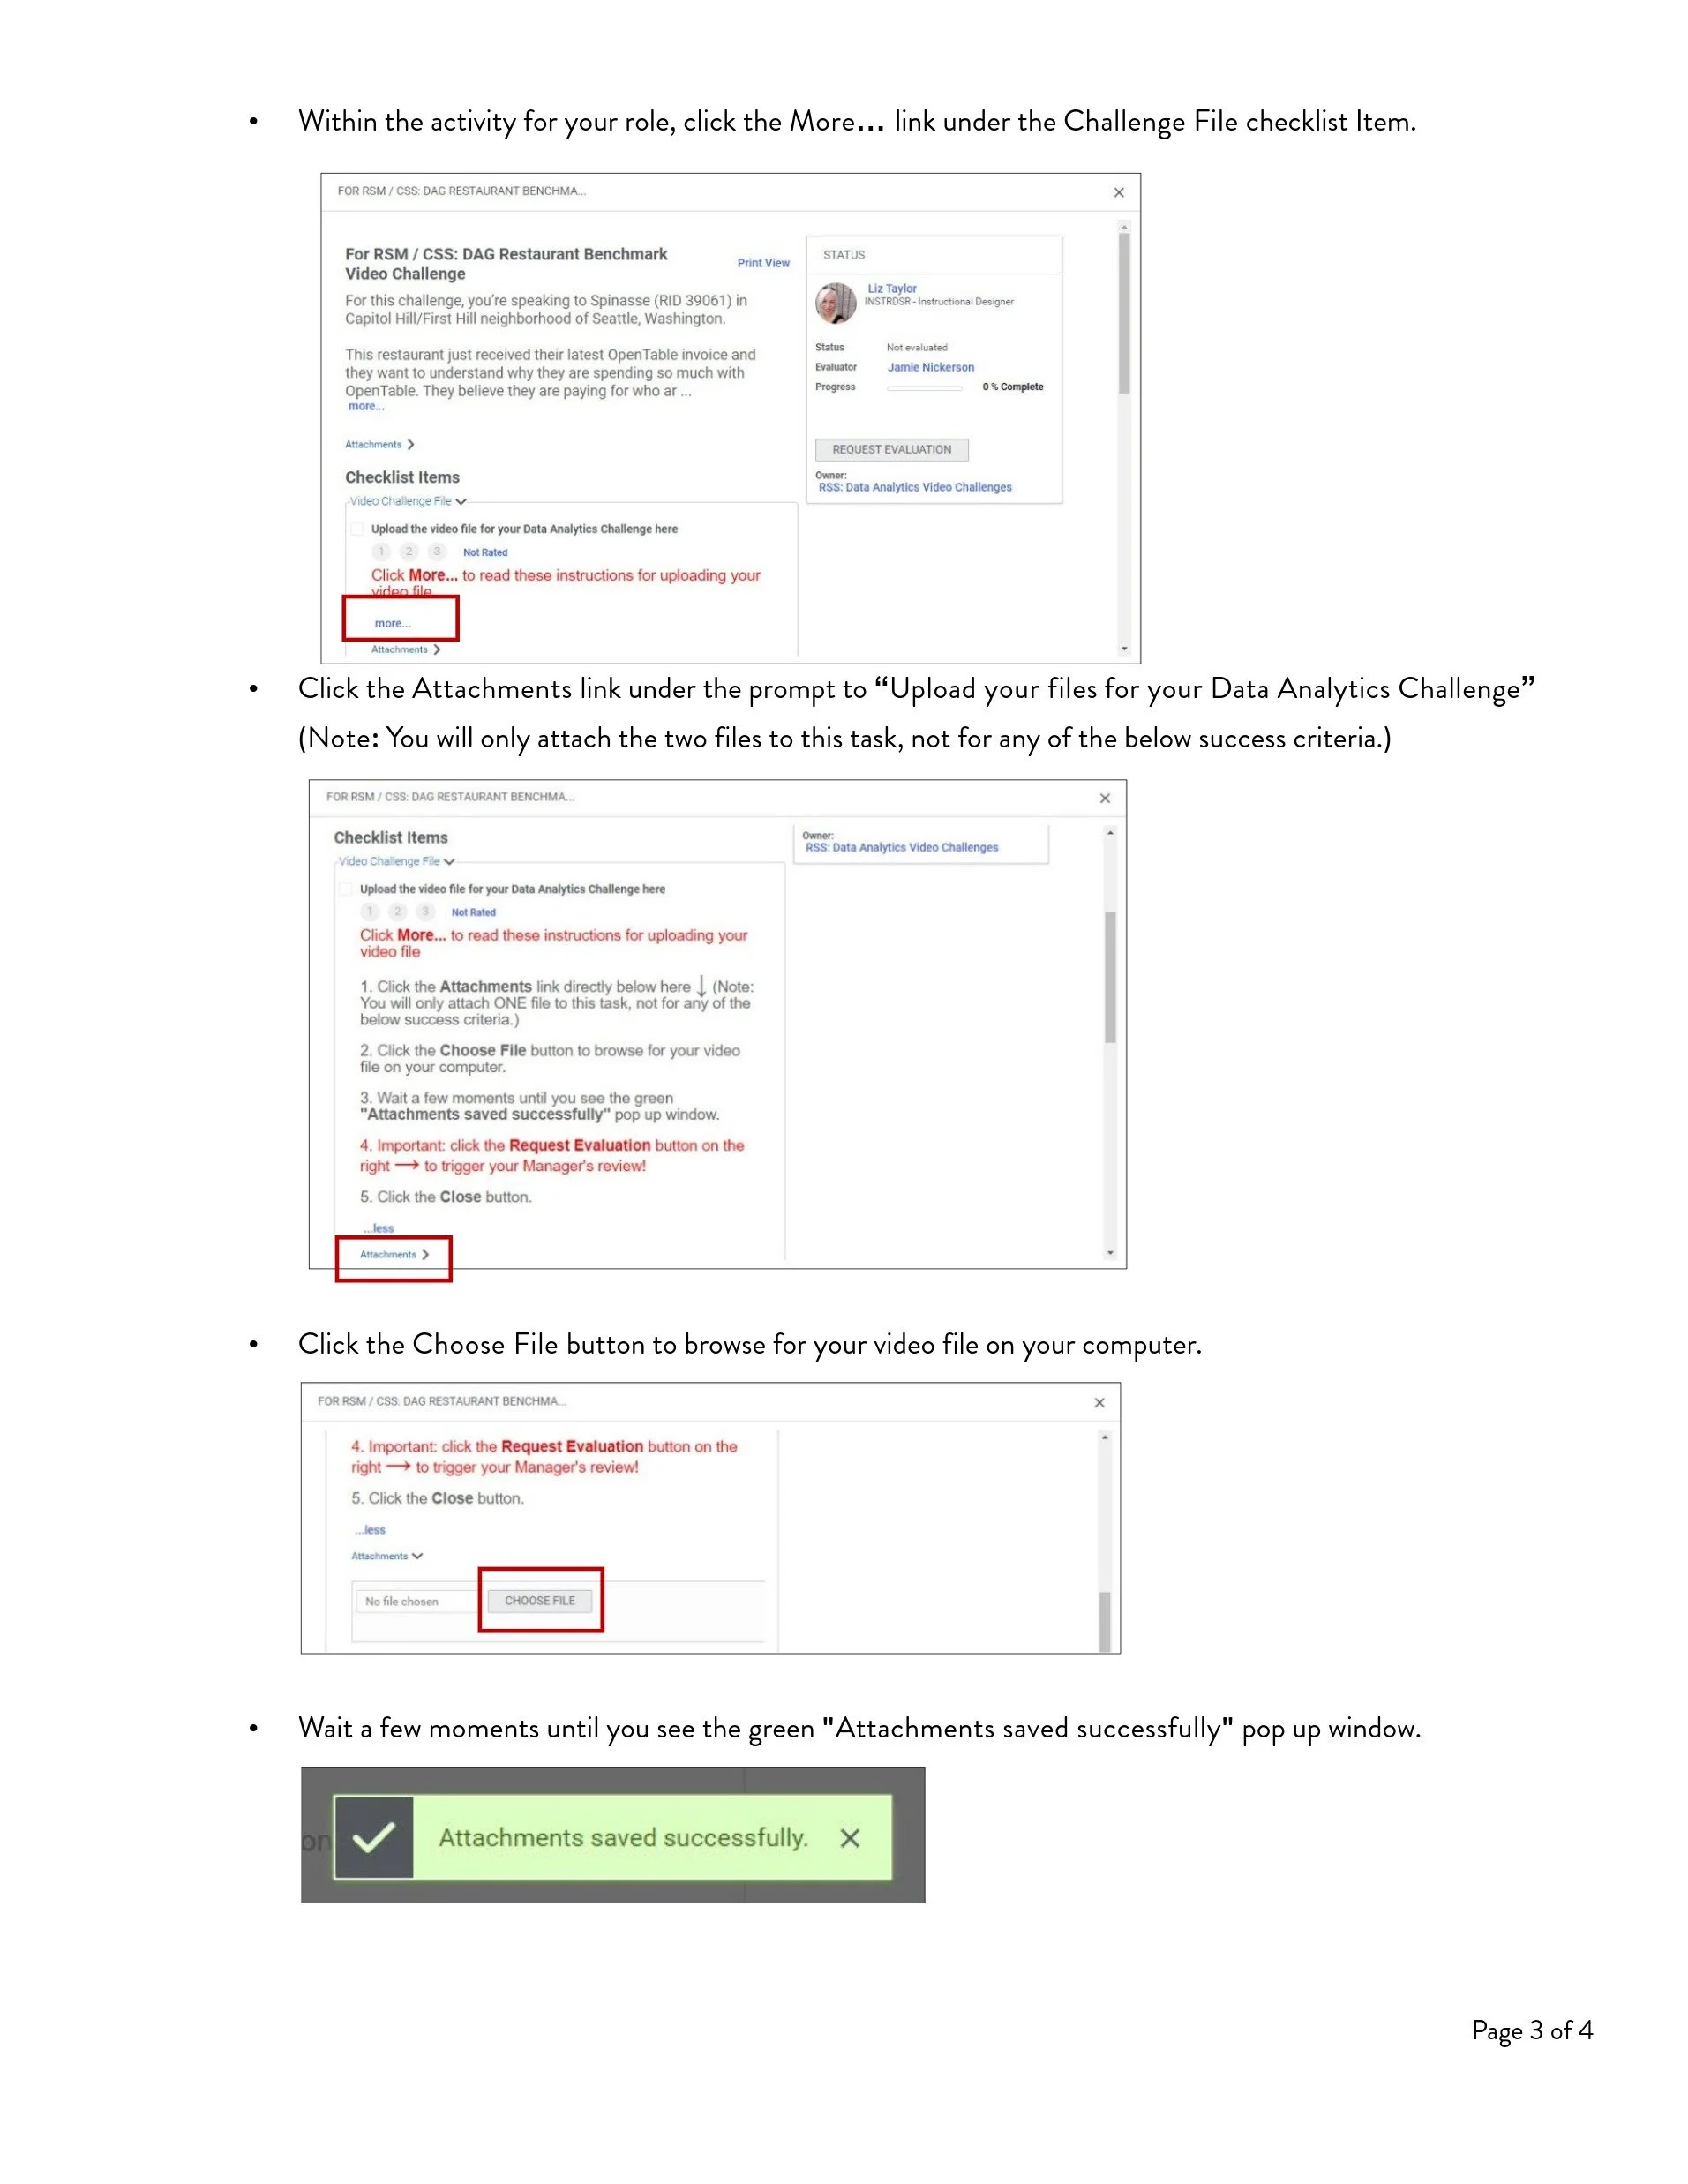
Reference materials: I developed a full suite of supporting content—step-by-step technical documentation, a video library, storytelling guides, and troubleshooting resources—to reinforce learning and build long-term confidence.
Deliverables
A comprehensive benchmarking program that blended:
Self-assessment to surface skill gaps and learning needs
Scenario-based analytics challenges using real reports and customer situations
Structured coaching and evaluation using clear success criteria
Evergreen reference materials (videos, guides, documentation) to reinforce ongoing development
Results
Established a baseline of analytics proficiency across multiple sales and service roles.
Improved ability to translate data insights into actionable customer recommendations.
Increased collaboration between reps and managers through structured coaching and feedback loops.
Created an evergreen reference library that supported ongoing skill development and reduced repetitive training needs.
Strengthened data literacy culture across the organization—linking analytics skills directly to customer success outcomes.
Sales Team Scenario Playbooks
